What exactly is unequal?
Two fictional households each receive $80,000 in annual income. The first has $5,000 in savings, no property and $20,000 in debt. The second owns a home worth $500,000, has a $200,000 mortgage and holds another $100,000 in financial assets. A chart of annual income puts them together. A balance sheet puts them far apart. If a major expense arrives next month, their options are unlikely to be identical. Before asking why people are unequal, we need to establish what we are comparing.
This course builds on Learning to See Society. It investigates resources, positions, recognition and opportunities, while keeping empirical explanations separate from moral judgments. The opening task is deliberately exacting: identify the unit, the measure, the period and the population behind a claim. Without those choices, an argument about inequality can change its meaning halfway through a sentence.
Income is a flow; wealth is a stock
Income records receipts over a period under a stated definition. Wealth records assets at a point in time; net worth subtracts liabilities from those assets. The distinction between a flow and a stock is essential. A household can have substantial assets and modest current income, or high current income and little accumulated wealth. Neither combination is contradictory.
In the example, the first household's net worth is $5,000 minus $20,000, or negative $15,000. The second's is $500,000 plus $100,000 minus $200,000, or $400,000. Their net-worth difference is $415,000 despite equal annual income. These stipulated figures omit any other assets and liabilities. A real comparison would need a consistent definition and valuation date, rather than adding whichever possessions happen to be mentioned.
Stocks change through several routes. Saving some income can increase assets. An asset's market value can rise or fall without a corresponding receipt of wages. An inheritance can transfer wealth between people. Debt repayment reduces liabilities, but its effect on net worth depends on what funds the payment. Paying a $1,000 debt with $1,000 already held in cash reduces assets and liabilities equally, leaving net worth unchanged at that instant. Interest and fees would require separate entries.
That last calculation exposes a common confusion. Reducing debt can improve a household's future cash commitments without immediately increasing measured net worth by the amount repaid. A measure answers one question, not every question about well-being. We should preserve the distinction between the balance sheet, the flow of payments and the conditions attached to those payments.
Liquidity and security add another dimension
An asset can have value while being difficult to use quickly. A home can provide housing and equity without supplying cash for tomorrow's expense. Liquidity concerns how readily an asset can be converted into usable funds without a large loss or delay. Two households with equal net worth can differ in how much of it is liquid. They can also differ in access to credit, insurance and reliable support from others.
Security concerns exposure to disruption and the capacity to withstand it. A stable income and a volatile income can have the same annual total. Imagine one household receiving roughly equal monthly amounts while another receives most of its income in two installments whose dates are uncertain. The yearly sum conceals the need to bridge gaps. A late payment can matter even if the eventual annual total is adequate.
These distinctions complicate simple rankings. The second household in our opening has a stronger balance sheet, but suppose its income is unusually unstable and its assets difficult to sell. That does not erase its wealth advantage. It adds information about the form and usability of the advantage. A careful account can describe several dimensions without forcing them into one universal score.
Consumption is another measure again: the goods and services people actually use. Borrowing or drawing down savings can sustain consumption when current income falls. A household may also consume housing services from a home it owns. Observed spending, current income and wealth therefore need not move together. Which measure is most informative depends on whether we are studying living conditions, resources, vulnerability or control over future choices.
The household is not the individual
An $80,000 household income supports a different arrangement when one adult lives alone than when several people depend on it. Some expenses are shared, so dividing by the number of people is not always an adequate adjustment. Housing, heating and a shared internet connection do not necessarily double when a second person arrives. Other needs, including food and some care, rise with household composition.
Equivalization means adjusting household resources using an explicit scale intended to account for size and composition. Different scales make different assumptions about shared costs and needs. We will not select one scale as universally correct. The useful habit is to ask whether a comparison uses raw household income, per-person income or an equivalized measure. They describe related but different objects.
Even an adjusted household total does not show how resources are distributed inside the household. One member may control spending decisions or have access to funds that another cannot readily use. A household-level measure can be appropriate for one research question while obscuring an individual-level inequality. The unit of measurement should never silently become a claim that every member shares equally.
The Census Bureau's 2023 ACS income definitions illustrate the need for precision. Household income includes income of household members aged fifteen and older, whether related or not. The survey's income measure excludes such receipts as loans, capital gains and lump-sum inheritances. It asks about the preceding twelve months, so interviews during 2023 can include income received during part of 2022. These are features of this measure, not universal definitions of every resource. ACS definitions.
A distribution contains more than an average
Consider five fictional annual incomes, in thousands of dollars: 20, 30, 40, 50 and 60. Their sum is 200 and their arithmetic mean is 40. Their median is also 40: two observations lie below it and two above. Now replace the final income with 160. The sum becomes 300 and the mean becomes 60, while the median remains 40. Only one value changed, yet the two summaries now tell visibly different stories.
The mean is total income divided by the number of units. The median marks the middle of an ordered distribution. Neither is inherently honest or dishonest. The mean is useful for connecting totals to numbers of units; the median describes the central position and is less affected by an extreme value. Trouble arises when a writer calls either one the experience of everyone, or selects the measure solely because it supports a preferred conclusion.
The median also leaves much unseen. In a third fictional distribution, incomes are 5, 10, 40, 100 and 145. The mean is again 60 and the median again 40, but the lower observations are substantially lower than in the second distribution. Two familiar summary statistics are identical while the distributions differ. To describe inequality, we need information about the spread and the allocation of resources across positions.
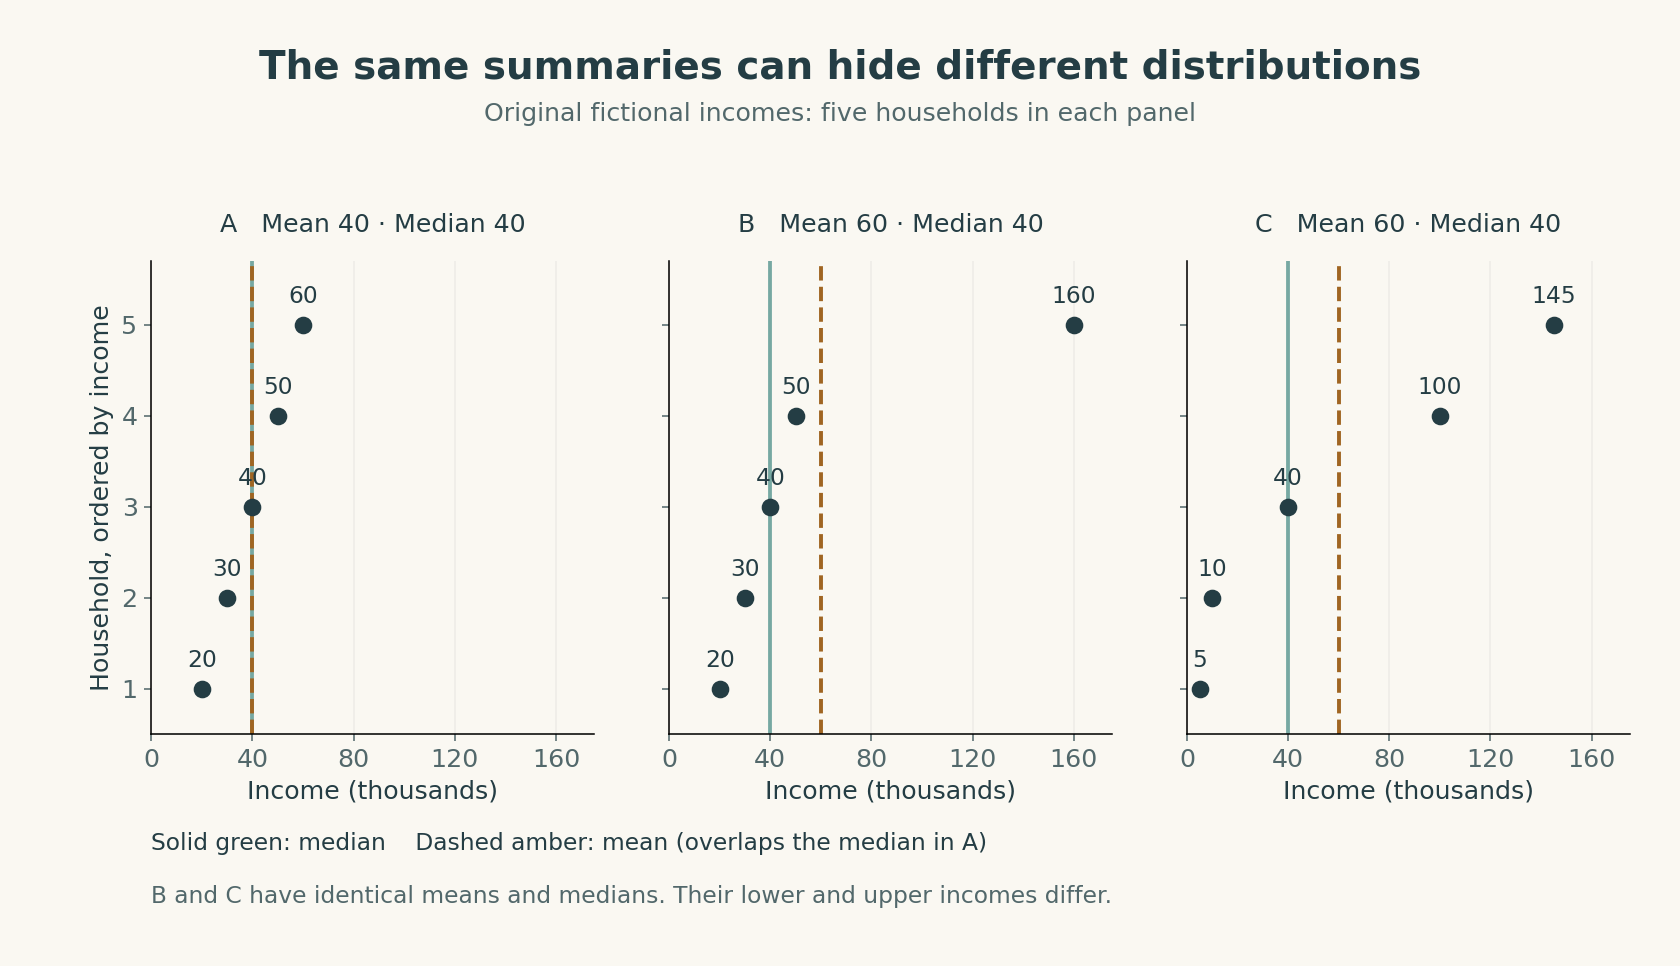
A percentile identifies a position in an ordered distribution. The fiftieth percentile is the median. A top share asks what fraction of the total belongs to a defined upper group. In our second distribution, the highest-income household receives 160 of the total 300, about 53.3 percent. In the first, it receives 60 of 200, or 30 percent. The comparison describes concentration among these five invented households; it is not an estimate of any country's top-income share.
Reading a real mean–median difference
The Federal Reserve's 2022 Survey of Consumer Finances reports median family net worth of $192,900 and mean family net worth of $1,063,700, expressed in 2022 dollars. Their reported standard errors are $7,500 and $23,200 respectively. These are survey estimates of net worth under the SCF's definitions. They are not current balances for a typical individual, and the SCF family unit is not identical to every other survey's household unit. Official report, Table 2.
The large difference signals that the mean and central position describe different aspects of the distribution. It does not tell us that the median family owns a particular mix of assets. Nor does it allow us to identify what fraction has more than a million dollars. Those questions need additional distributional information. A mean above a threshold does not establish that most observations exceed it.
The sampling uncertainty does not make the two estimates interchangeable. Their difference is far larger than their reported standard errors. Yet the errors remind us that the estimates were produced through a survey rather than by opening a complete ledger of every family's wealth. Sampling design, nonresponse, valuation and the treatment of difficult-to-measure assets remain relevant to the interpretation.
A standard error describes uncertainty in an estimate arising from a sampling procedure; it is not the spread of wealth among families. Confusing those two forms of variation can produce a striking error: a narrow confidence interval around an estimated mean does not imply that families have similar wealth. We can estimate the average quite precisely in a population whose members differ enormously.
Inequality, poverty and prosperity can move differently
Suppose every income in the first fictional distribution doubles. The new values are 40, 60, 80, 100 and 120. Each household has twice as much income in the stipulated purchasing-power units, and the ratios among incomes remain unchanged. A measure based on relative shares can remain constant while living standards improve. The absolute distance between the highest and lowest incomes grows from 40 to 80.
Alternatively, suppose the highest income falls while all others remain unchanged. Relative inequality can decline without anyone at the bottom becoming better off. That does not make the decline irrelevant, but it means “less unequal” and “better for the poorest” are different statements. A policy discussion should specify which outcome it values and examine both when they matter.
Poverty concerns falling below a defined standard of resources or living conditions. An absolute standard holds a real threshold fixed under a stated adjustment; a relative standard can depend on the surrounding distribution. These approaches answer different questions about material sufficiency and participation in a society. We are defining the distinction here, not reporting a specific official poverty rate or claiming that every country uses the same threshold.
The Gini index summarizes inequality across a distribution. For the nonnegative income examples used here, zero represents equal incomes and values nearer one indicate greater concentration. One intuition is to order households from low to high and compare their cumulative share of income with their cumulative share of the population. Equal shares trace equality; concentration causes the income share to lag. A single Gini value still cannot reveal where every difference occurs, and wealth distributions with negative values require additional care.
Prices, periods and comparisons
Nominal amounts are expressed in the currency units of the stated period. Real amounts adjust for a chosen price index. If income rises by five percent while the relevant price level also rises by five percent, the simplified comparison leaves purchasing power unchanged. The choice of price index matters because households do not buy identical baskets of goods and services.
A national inflation adjustment also differs from an adjustment for price differences across places. Reporting two states' incomes in 2023 dollars does not mean their housing, transport and other costs are equal. A higher nominal state median therefore cannot by itself rank residents' living standards. Household composition, public services and the distribution within each state add further questions.
Periods must be aligned as well. An annual income measure can smooth over temporary hardship; a single month's earnings can misrepresent seasonal work. A one-time wealth observation can be sensitive to asset prices on that date. Comparing a three-year average for one group with a single year for another introduces a difference in measurement that might be mistaken for a difference in economic position.
For our later data exercise, we use a fixed vintage: the 2023 ACS one-year estimates as published in a September 2024 Census brief. The national median household income is $77,719 with a 90-percent margin of error of $186. The date and margin belong with the number. The estimate is neither a forecast nor a description of an identified household. Census brief, Table 1.
Weighting is a further choice. Imagine a survey containing ten households from a small town and ten from a large city. Giving each response equal weight would give the places equal influence, even if their populations differ greatly. A population estimate needs weights appropriate to the sampling design and target population. Weighting does not repair every missing response or measurement error, but it changes what an average represents. Whenever a table describes millions of households using a much smaller sample, the calculation is usually more involved than adding the observed answers and dividing by their number. We should use the published survey estimate and its documented uncertainty rather than reconstruct an unweighted substitute.
Respect, occupation and control resist a single dollar scale
Resources are not the only things distributed unequally. People differ in recognized status, authority over work, schedule control and opportunities to enter valued activities. These dimensions can correlate with income without being reducible to it. A person can receive a high income while lacking local respect, or hold considerable organizational authority without owning the organization. The next chapter develops these distinctions through theories of class and status.
Occupation is sometimes used as an indicator of social position because work connects skills, authority, security and rewards. But an occupational title can cover very different arrangements. A self-employed specialist, a salaried specialist and a specialist supervising a team may share a label while occupying different relations to risk and control. A title is a starting point for classification, not a complete explanation of a person's life.
The serious objection is that multiplying dimensions can make every comparison inconclusive. The answer is to choose measures according to the question, rather than require one perfect index of human advantage. To study the capacity to meet an immediate expense, investigate liquid resources and obligations. To study command over production, investigate ownership and authority. To study recognition, investigate how others allocate respect and access. Precision narrows the task enough to make evidence useful.
Before accepting a claim about inequality, reconstruct its sentence: unequal in what, among whom, measured when, in which units, with what uncertainty? Then ask whether the conclusion stays within that sentence. Our two $80,000 households demonstrate why this discipline matters. Their equal incomes are a real similarity, but a poor substitute for the balance sheets and commitments that shape their available choices.
Application
Recalculate the means, medians and top-household shares for the three fictional distributions. Then write a 150-word comparison of the opening households that separates income, net worth, liquidity and security. Finally, annotate the national ACS median with its population, period, unit and margin of error.
Check your understanding: If mean net worth exceeds a million dollars, must most families be millionaires, and does paying a $1,000 debt from $1,000 of existing cash immediately increase net worth by $1,000?
Expected answer: No to both. A mean can be raised by large values and does not identify the fraction above a threshold. Repaying principal from existing cash reduces assets and liabilities equally, leaving net worth unchanged at that instant; future payments, interest and liquidity are separate considerations.