What injury and measurement can tell us
A headline announces that scientists have found the brain's “cup-recognition center.” Under it sits a colorful image with a small bright patch. Before accepting the claim, ask what the participants did, what the instrument measured, what comparison produced the color, and what alternative explanations remain. These questions do not diminish neuroscience. They are how neuroscience turns a striking picture into evidence about a living system.
Every method has an object
A microscope, an electrode, a structural scan, a functional scan, and a behavioral test observe different things. A method is useful when the observed property bears on the question. It becomes misleading when the explanation silently substitutes a different property. An anatomical connection does not establish when it is used. A task-related signal does not establish that the region is necessary. A behavioral difference does not identify one cellular mechanism.
Consider four questions about the cup task. Where do the relevant pathways run? When does activity change after the cup appears? Does disrupting part of a pathway alter recognition or reaching? Can a pattern of measured activity predict which task the participant is performing? These questions require different evidence. A complete account may combine methods, but the combination works only if their distinct contributions remain visible.
The word measurement also does not mean unprocessed observation. Instruments sample physical signals, and those signals are transformed through calibration, filtering, reconstruction, or statistical analysis. The transformations can be appropriate and necessary. A responsible interpretation asks what was done and whether the resulting quantity matches the claim, rather than treating every processed image as either an untouched photograph or an arbitrary invention.
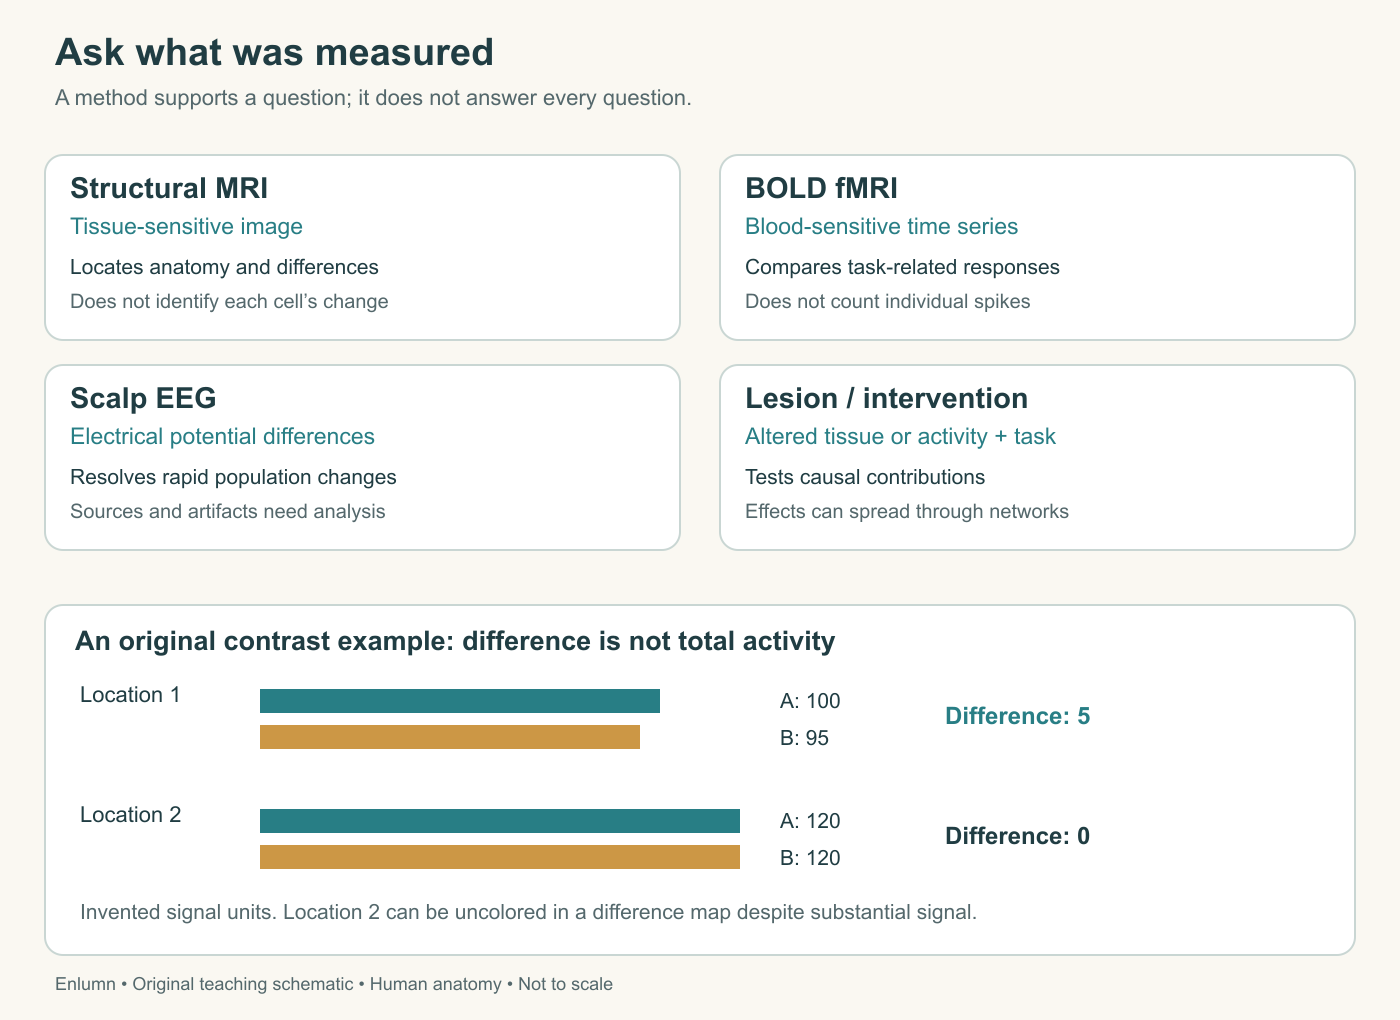
Use the lower panel to separate a difference from an absolute signal. Both invented measurements at Location 2 exceed those at Location 1, yet their difference is zero. The example makes no claim about a real scanner’s units or baseline; it shows the arithmetic behind a task contrast.
Structural imaging shows organized tissue
Magnetic resonance imaging, or MRI, uses magnetic fields and radiofrequency signals to produce measurements from which images of tissue can be reconstructed. Different acquisition methods emphasize different tissue properties. A structural image can help distinguish gray matter, white matter, fluid spaces, and other features. Its contrast is not simply the tissue's natural color. NIBIB's MRI reference introduces the physical method and its uses.
A voxel is a small three-dimensional element in an image volume. It contains contributions from many cells and, depending on its location and size, potentially more than one tissue type. A change in an image-derived measure therefore cannot be equated automatically with the birth of one kind of cell. The measurement is at a different scale from the cellular claim.
The taxi-training figure in Chapter 7 illustrates this point. Its colors summarize a structural comparison between time points. They do not identify the firing of individual neurons while someone imagines London. The anatomical images help locate the reported difference, but the meaning of the overlay comes from the analysis and caption. A familiar visual format does not tell us which physical property was measured.
Structural imaging can also reveal a lesion or other tissue alteration. Lesion means an area of damage or abnormal tissue; it does not specify a single cause. Location matters, but so do extent, affected connections, timing, and the state of the wider brain. Two lesions described with the same broad regional label can differ substantially in their functional consequences.
Functional imaging measures an indirect signal
A common form of functional MRI, or fMRI, uses blood-oxygenation-level-dependent, or BOLD, contrast. The signal is sensitive to changes involving blood oxygenation and related vascular processes. Neural activity is linked to local metabolic and blood-flow responses, allowing useful inferences about task-related activity. The scanner does not directly count every action potential or read neurotransmitter molecules at each synapse. NIMH's imaging-methods account describes this physiological basis.
The response unfolds more slowly than the fastest electrical events. A sequence of neural operations occurring within a short interval can contribute to an overlapping vascular response. This makes fMRI useful for some spatial questions while limiting what can be inferred about the exact order of rapid events from an ordinary task map. Better temporal sampling of the image does not eliminate the physiology linking neural activity to the signal.
Most familiar activation maps show a contrast between conditions, such as viewing cups versus viewing other objects. A colored region indicates a difference under the analysis used. An uncolored region is not necessarily inactive, unnecessary, or uninvolved. It may be similarly active in both conditions, poorly measured, variable across people, or below the chosen reporting threshold.
Use an original example. Suppose a fictional signal measure averages one hundred units in condition A and ninety-five in B at one location. At another location it averages one hundred and twenty in both. A difference map can highlight the first location and leave the second uncolored, even though the second has the larger absolute values in this invented measurement. The map answers a comparison question, not “which parts of the brain exist or work?”
Changing the comparison changes the interpretation. Cups versus a blank screen includes differences in visual stimulation, recognition, attention, and perhaps naming. Cups versus visually similar unfamiliar objects addresses a narrower set of possibilities but introduces others, including familiarity. No comparison is automatically perfect. Good research explains which alternatives it constrains and which remain.
Electrical recording has different strengths
An electroencephalogram, or EEG, records voltage differences through electrodes, often placed on the scalp. Scalp signals reflect the combined electrical effects of populations of neurons, especially synchronized synaptic currents, filtered by the intervening tissues and recording arrangement. They are not a direct list of each neuron's spikes. The American Epilepsy Society's introductory EEG text explains this distinction and the basis of the method.
EEG can resolve rapid changes in time, making it useful for questions about the timing of responses. Locating the exact sources is harder: different arrangements of underlying activity can contribute to similar scalp patterns. This is an inverse problem, where one tries to infer the generating sources from the measurements they produce. Anatomical models and additional information help, but a colored scalp map is not itself a precise map of activity directly below every electrode.
Eye movements, blinking, muscle activity, and environmental sources can also influence recordings. These are often called artifacts relative to the brain question being studied. They are real physical signals, not imaginary noise. If a participant blinks more in one task condition, the resulting difference must not be casually attributed to a new cognitive process. Measurement quality includes understanding competing signal sources.
Intracranial recordings can measure activity closer to neural tissue, sometimes at much finer spatial scales. In humans, access is usually tied to clinical circumstances and specialized research arrangements. Such recordings provide valuable evidence but sample particular locations in particular participants. Recording precisely from one site is different from observing the whole brain without sampling limits.
For an original timing example, suppose an EEG feature differs between two tasks two hundred milliseconds after a stimulus. The observation constrains when a difference is detectable in that measurement. It does not prove that the responsible process began exactly then, that only one process contributed, or that its source is known from the latency alone. Timing evidence becomes stronger when combined with appropriate comparisons and other measurements.
Injury and intervention address causal questions
If damage to a region reliably impairs a task, the region or its connected pathways may be necessary for normal performance under those conditions. That is stronger causal evidence than a simple correlation between activity and behavior. Yet it does not establish that the damaged region alone performs the entire task. A broken connection can disable a network contribution, and damage can alter activity elsewhere.
The memory case in Chapter 7 is useful because some abilities were profoundly impaired while others remained relatively preserved. Such a dissociation argues against treating all abilities as one undifferentiated faculty. A double dissociation, in which different impairments show complementary patterns across tasks, can strengthen an argument for distinguishable contributions. It still requires careful attention to task difficulty, measurement reliability, and the nature of the injuries.
Use a fictional example. Participant A performs poorly on object naming but relatively well on a location judgment. Participant B shows the reverse. This pattern suggests that the two tasks do not depend identically on one general resource. It does not by itself prove that there are exactly two independent boxes labeled names and locations. The tasks may share some processes and differ in others, and the lesions may affect several connected components.
Research interventions such as transcranial magnetic stimulation, or TMS, can temporarily influence neural activity through an externally induced electric field. Under controlled conditions, comparing task performance across stimulation sites and timings can test causal contributions. The induced effects have spatial and network limits; stimulation is not a perfect switch for one mental faculty. NIMH’s research-method lecture explains how local stimulation can influence connected networks. This is a description of a research method, not an activity for readers to perform.
The distinction between necessary and sufficient is central. A component is necessary under a specified set of conditions if the outcome depends on it there. A condition is sufficient if it can produce the outcome under the stated circumstances. Showing that a damaged connection impairs reaching does not show that activating that connection alone produces a complete, appropriate reach. Many cooperating conditions may still be required.
Why reverse inference needs care
Reverse inference occurs when a measured brain response is used to infer a particular mental process. For example: region R often responds during a certain kind of memory task; R responds now; therefore the person must be remembering in that way. The conclusion does not follow with certainty because R may also respond in other situations. The selectivity of the evidence matters.
Poldrack's 2006 analysis explains why such inferences depend on how selectively a response is associated with the proposed process. The argument does not say that brain measurements can never inform us about mental activity. It says that an observed response is more informative when competing causes and prior probabilities are considered. A familiar region name is not enough.
Work through an original hypothetical example with one hundred trials. In twenty, the process of interest truly occurs; in eighty, it does not. A certain response is detected in sixteen of the twenty process-present trials and sixteen of the eighty process-absent trials. The response is common when the process occurs, appearing eighty percent of the time. But among the thirty-two trials with the response, only sixteen contain the process: fifty percent.
The two percentages answer different questions. “How often does the response appear when the process occurs?” is not the same as “How often is the process occurring when the response appears?” Reversing the direction changes the denominator. This arithmetic is invented for teaching and does not characterize any actual brain region. It demonstrates why a strongly worded headline can be unsupported even when a real association exists.
A predictive model can improve on casual reverse inference by being tested on held-out observations. Yet prediction also needs a clearly defined task and population. Successful classification among a small set of laboratory conditions does not establish unrestricted mind reading in everyday life. Performance on new participants, unfamiliar conditions, and alternative explanations determines how far the claim travels.
From a result to a responsible claim
A result should be described at the level measured. “The BOLD contrast differed between the tasks” is a measurement claim. “The region contributes to recognizing familiar objects” is a functional interpretation. “This is the only place where cups are recognized” is a much stronger exclusivity claim. Each step needs additional support. Clear scientific writing makes the steps visible rather than compressing them into one impressive sentence.
Statistical thresholds also affect what appears on a map. Testing many locations creates opportunities for apparent differences by chance, so analyses need methods appropriate to multiple comparisons. A threshold is a rule for reporting evidence, not a physical boundary between functioning and nonfunctioning tissue. Larger samples, replication, and transparent analysis choices help assess whether a finding is stable.
Group averages can conceal variation. A result reproducible on average does not mean every participant has an identical response at an identical coordinate. Differences in anatomy, strategy, experience, and measurement can matter. Conversely, individual variation does not make group findings meaningless. The appropriate conclusion depends on whether the question concerns a population pattern, an individual prediction, or a mechanism expected to apply under specified conditions.
There are also questions for which the evidence remains incomplete. How particular neural activity relates to the detailed character of conscious experience is not settled by assigning an anatomical label. A course can explain established pathways and careful experiments while preserving uncertainty about broader theories. Intellectual honesty requires neither pretending to have solved consciousness nor treating all neuroscience as speculation.
Explain the cup without inventing a center
A successful final account begins with the physical scene and follows a selected visual route into connected processing systems. It distinguishes the left visual field from the left eye, explains how cellular signals and synapses support communication, and connects sensory information with motor planning and control. It then traces descending influence through spinal circuits and lower motor neurons to muscles, with feedback from the moving body.
The explanation also includes what keeps the system working: vascular supply, regulated cellular environments, arousal, and internal bodily conditions. Memory contributes prior knowledge and learned skill without turning the hippocampus into a warehouse for every detail. The account uses different anatomical structures for different contributions while preserving their relationships. It does not need every nucleus to be useful, but each arrow it includes should have a meaning.
Finally, specify what would count as evidence for one part of the account. A pathway diagram supports an anatomical prediction; a behavioral comparison distinguishes task demands; an electrical recording constrains timing; a structural image locates tissue; a functional contrast shows an indirect task-related difference; a controlled intervention can test a causal contribution. Combining these is more informative than asking one bright patch to explain the person.
Check your understanding: Why can a region be uncolored in a task-contrast map and still contribute importantly to both tasks?
Expected answer: The map displays an analyzed difference between conditions, not all activity or necessity. A region can contribute similarly to both tasks, fall below a threshold, or be imperfectly measured. Establishing its causal contribution requires additional evidence beyond whether a difference map colors it.
Application
Allow 35–40 minutes. Write an 800–1,200-word illustrated explanation of seeing a cup, choosing it, reaching, and adjusting when it moves. Include a labeled network diagram, one cellular mechanism, one sensory-to-motor connection, one feedback loop, and one contribution from regulation or memory. Distinguish information routes from material supply.
Then critique this invented headline: “A bright brain patch proves that cups have their own recognition center.” The supplied fictional study compared pictures of familiar cups with a blank screen in twenty volunteers, measured BOLD fMRI, and reported a group-average contrast. State what the observation supports, identify two alternative explanations, and propose one better comparison. Do not invent missing results.
A successful capstone uses correct anatomy, distinguishes synaptic signaling from whole-person behavior, identifies the measurement and its comparison, and avoids exclusive centers, left-brain/right-brain personality claims, or certainty about consciousness. Check your diagram against Chapters 1–6 and your inference against the worked probability example before calling the explanation complete.