Airflow and blood flow together
Two delivery routes can each carry enough material in total and still fail to meet where the work occurs. In a lung, the problem is not solved by adding up all the incoming air and all the circulating blood. Their local distribution matters. A well-ventilated region is of limited use for supplying the circulation if little blood passes its exchange surface.
We will build a model with several regions and keep a separate account for each. The aim is to understand ventilation–perfusion relationships, then reconnect those regional accounts with the blood leaving the lung. The numbers are invented teaching values, not clinical measurements or normal ranges.
Start with two routes to one region
Alveolar ventilation describes renewal of gas in the exchange region; perfusion describes blood flow through it. Their ratio is conventionally written V/Q, with V referring here to alveolar ventilation per time and Q to blood flow per time. Regional gas conditions depend on this relationship, together with the entering gas and blood and the exchange properties. Petersson and Glenny: ventilation–perfusion review.
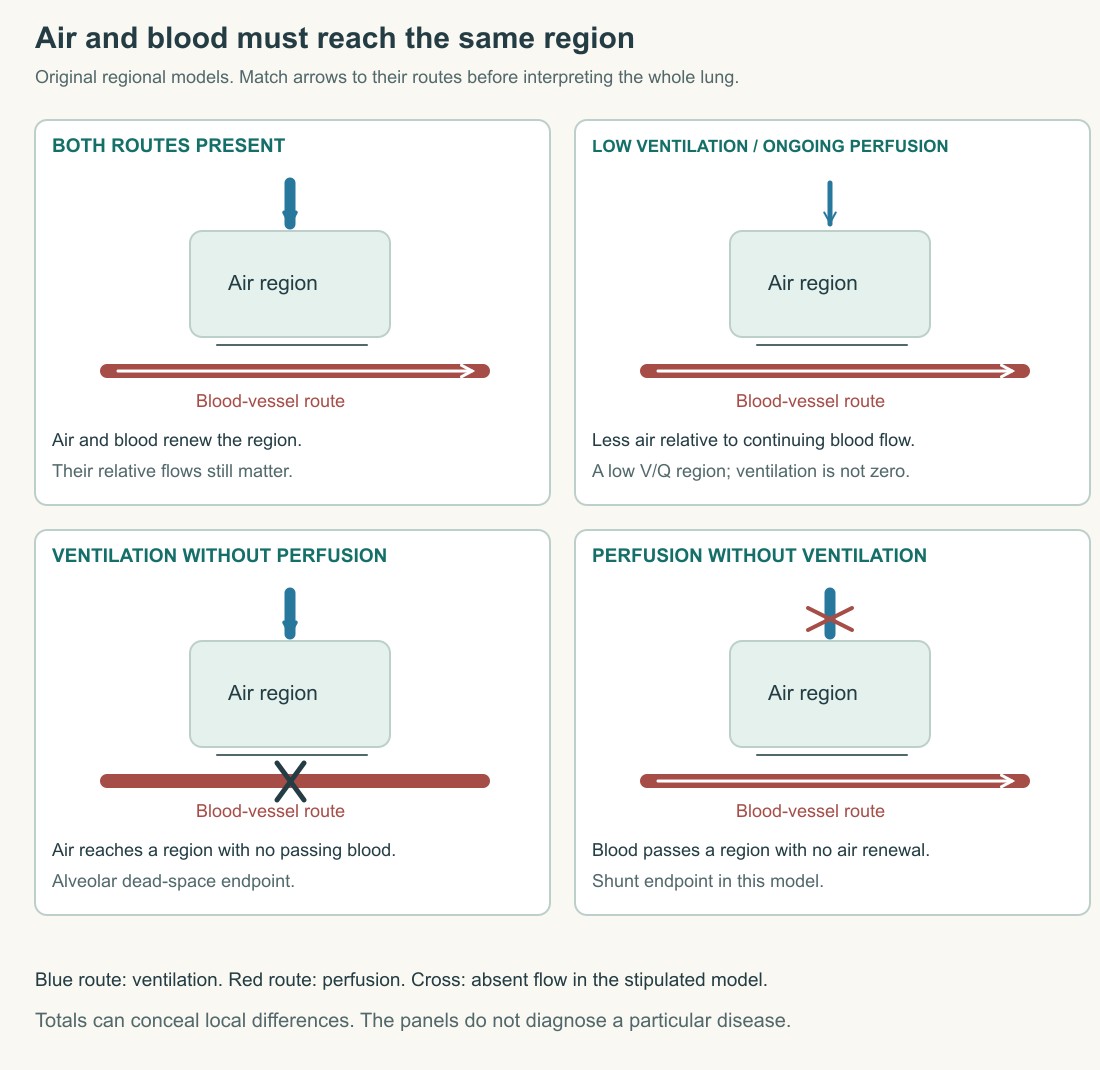
Put two arrows into a box: an air route at the top and a blood route at the side. Give them different colors, and keep the outgoing blood separate from the outgoing air. This small diagram is enough to ask a causal question: what changes if one input changes while the other remains fixed?
Suppose the model region receives four ventilation units and four blood-flow units per interval. Its ratio is one. Reducing ventilation to two while keeping blood flow at four lowers the ratio to one half. Reducing blood flow to two while keeping ventilation at four raises it to two.
Those ratios state a relationship. They do not mean that one volume unit of air is chemically equivalent to one volume unit of blood, or that a ratio of exactly one is universally ideal for every real region. Matching is a physiological relationship, not a demand for identical numerical labels.
The same ratio can also conceal a change in scale
Compare a region receiving four ventilation units and four perfusion units with one receiving one of each. Both have a ratio of one. The second, however, processes smaller flows per interval. A ratio alone has discarded that information.
This is a different limitation from the regional averaging problem we will examine below. Even a perfectly specified single-region ratio needs its numerator and denominator if the question concerns total throughput. Keep all three values in the margin: ventilation, perfusion and their quotient.
The arithmetic supplies a useful challenge to a vague report. If someone says the ratio was unchanged, ask whether both flows stayed unchanged or whether they changed proportionally. Either situation can produce the same quotient. The answer matters before we infer how much oxygen-bearing blood the region can contribute per unit time.
Total ventilation includes air that does not renew the exchange region
Tidal volume is the amount moved in a breath, and minute ventilation combines volume per breath with breaths per minute. A simple alveolar-ventilation account subtracts dead-space volume from each tidal volume before multiplying by breathing frequency. Conducting passages account for anatomical dead space. Hallett Reid, Toro and Ashurst: tidal volume.
Take two invented breathing records with a fixed dead-space allowance of one volume unit per breath. Record A moves five units per breath for ten breaths per minute. Its minute ventilation is fifty and its modeled alveolar ventilation is forty. Record B moves two and a half units per breath for twenty breaths per minute. Its minute ventilation is also fifty, but its modeled alveolar ventilation is thirty.
The difference comes from how frequently the dead-space allowance is included in the total. It is not evidence that everyone should adopt the slower record. The model omits muscle work, actual body dimensions, airway properties and regulation; it is an accounting comparison under stipulated conditions.
Anatomical dead space also does not mean the same individual molecules remain trapped forever in the trachea. Gas shifts and mixes during breathing. The term describes a functional volume in the respiratory route, not a permanent identity assigned to a fixed set of molecules.
Add a second region and the average becomes less informative
Consider two regions, each initially receiving four ventilation units and four perfusion units. Combined ventilation is eight, combined perfusion is eight, and each regional ratio is one. Now redistribute the same ventilation: region A gets seven and B gets one, while perfusion remains four in each.
The combined ratio still equals one. The regional ratios are now 1.75 and 0.25. A whole-lung total has concealed the mismatch we deliberately introduced. Nothing in the arithmetic permits us to conclude that the gas exchange is unchanged merely because the overall ratio is unchanged.
This is one reason to draw multiple units. Glenny's teaching review recommends building from a simple unit toward more complex regional models as learners develop the necessary distinctions. Glenny: teaching V/Q relationships.
The lesson extends beyond averaging. Before accepting any summary value, ask what kinds of differences it could hide. A useful average is still a summary. It cannot preserve every relationship among the components from which it was calculated.
Follow the blood through an underventilated region
When ventilation is low relative to perfusion, the region's gas conditions shift toward those of the incoming blood rather than being renewed as effectively by inspired gas. Low V/Q regions can therefore contribute less well-oxygenated blood to the mixed outflow. Petersson and Glenny: regional gas exchange.
Trace the branch with your finger. The vessel remains open; the blood is still moving. The difficulty is that its local air supply has become inadequate relative to that flow. Labeling the region no circulation would describe the opposite failure and predict a different contribution to the outgoing blood.
A thought experiment makes the direction clearer. Begin with a region receiving both routes, then progressively reduce only its ventilation. At each step, retain the same entering blood conditions in the model. The diminishing renewal of alveolar gas changes the setting in which that blood can exchange gases.
Do not instantly replace low ventilation with zero ventilation. A partially supplied region and a completely unsupplied one are distinct cases. A continuum is easier to understand once the endpoints are clear, but the endpoints should not erase everything between them.
The two extremes waste different opportunities
Perfusion through a region with no ventilation represents a shunt endpoint in this model. Ventilation of a region with no perfusion represents an alveolar dead-space endpoint. They are opposite limits of the air–blood relationship. Petersson and Glenny: shunt and dead space.
For the shunt endpoint, draw the airway stopped and the vessel continuing. Blood contributes to the outgoing circulation without gaining the benefit of ventilation in that unit. For the dead-space endpoint, draw the airway continuing and the vessel stopped. Air is moved to a region that has no passing blood to carry exchanged oxygen away.
One case wastes an opportunity to oxygenate moving blood; the other wastes an opportunity to use moved air for exchange with blood. This wording is a deduction from our two-route model, not a claim that every real disease fits perfectly into one panel.
Be precise about the ratio at the dead-space endpoint. If perfusion is exactly zero, division by zero is not an ordinary finite calculation. Physiologists describe the ratio as tending toward infinity as positive perfusion becomes smaller while ventilation persists. The limit conveys the direction; it is not a measured infinite flow of air.
Blood mixing requires amounts, not an average of pressures
When blood from different regions joins, oxygen content and blood-flow contributions govern the mixed oxygen amount. Simply averaging the regions' oxygen partial pressures does not perform that accounting, because content and partial pressure have a nonlinear relationship through oxygen binding. Petersson and Glenny: mixing regional outflows.
Suppose one invented stream carries ten oxygen units per blood-volume unit and a second carries six. If each supplies one volume unit, their combined two units of blood contain sixteen oxygen units. Mixed content is eight per volume unit.
Now let the first stream supply three blood-volume units while the second supplies one. The combined oxygen amount is thirty plus six, divided across four blood-volume units, giving a content of nine. The unweighted average of ten and six would still give eight, and would now be wrong.
The calculation follows conservation of amount. Label the flow contribution before multiplying it by content. If you have only partial-pressure readings, additional information is needed to connect those readings with contents before mixing. A number is useful only when it represents the quantity required by the operation.
An overventilated neighbor cannot be assumed to cancel the problem
It is tempting to say that one region's excess ventilation compensates automatically for another's shortage. Our previous chapter provides a reason for caution: hemoglobin binding approaches a capacity limit. Increasing oxygen conditions in a stream already near that bound cannot add bound oxygen without limit.
Use a deliberately simple carrier model with a maximum of ten bound units per blood-volume unit. Region A supplies blood at nine and region B at five, in equal volumes. Their mean bound content is seven. Improving A to its stipulated maximum of ten raises the mean only to seven and a half. It does not restore the two-stream mean to nine.
The model ignores dissolved oxygen and does not compute an actual clinical response. It demonstrates the algebra of a bounded quantity. A gain on one side and a loss on another do not cancel automatically when the gain is limited and the starting states differ.
This also explains why relocating ventilation can matter even if its total stays constant. Our seven-and-one ventilation distribution is not interchangeable with four-and-four merely because both sum to eight. The local relationship and the content of the resulting blood need to be followed through the system.
The lung can alter regional blood distribution
Low oxygen in a lung region can produce local pulmonary vasoconstriction, reducing blood flow toward that region. The response can help redistribute perfusion, although its mechanisms and effects depend on conditions. Sylvester and colleagues review evidence from humans and experimental preparations while emphasizing the limits of generalization. Sylvester and colleagues: hypoxic pulmonary vasoconstriction.
In our model, imagine reducing the fraction of blood directed toward an underventilated unit and increasing the fraction toward a better-ventilated one. The mixing calculation predicts that the final content can improve when more blood comes from the better-oxygenated stream, provided those regional contents remain as stipulated.
That last condition matters. Redistributing flow may itself change the receiving region's V/Q relationship. A calculation that silently freezes all regional conditions while moving large quantities of blood may overstate the benefit. Follow the consequences of your own change through the model.
The response also cannot be described as a guarantee of perfect matching. A local adjustment has limits, and a lung with many affected regions presents a different problem from a lung with one isolated poorly ventilated region. The existence of regulation is evidence of a mechanism, not proof that its desired result is always achieved.
Position and structure make real lungs heterogeneous
In an upright lung, ventilation and perfusion vary with vertical position, and they do not vary in identical proportions. The branching structures and surrounding pressures complicate a simple top-to-bottom picture. Binks's introductory account describes the resulting regional V/Q differences. Binks: distribution of ventilation and perfusion.
Treat a vertical schematic as a model for a specified position. Rotating a drawing without reconsidering gravity would make its labels misleading. Nor should a single horizontal line on that drawing be interpreted as a boundary at which all real alveoli abruptly change behavior.
We began with boxes because boxes let us hold variables fixed and reason clearly. Real anatomy then asks which variables actually remain fixed. Regions differ in their geometry and mechanical environment, and a whole organ contains many such differences at once.
A good model survives this transition by keeping its relationships while relaxing its simplifications. We do not abandon V/Q because lungs are complex. We stop assuming that one ratio, one shape or one posture captures every local condition.
Oxygen must still leave the lung and reach tissues
The pulmonary story connects with the circulation taught in The Heart. Blood leaving the lungs is part of a continuing route. An oxygen content describes what a quantity of blood carries; multiplying by blood flow describes an oxygen delivery rate in a simplified accounting model.
If blood carries eight oxygen units per volume unit and two blood-volume units pass per interval, delivery is sixteen oxygen units per interval. Keeping the content at eight while halving flow halves this delivery rate. A satisfactory content alone cannot establish the amount delivered per time.
Conversely, a high flow cannot be assumed to solve every limitation in content. The multiplication requires both factors. This is why ventilation, exchange, carriage and circulation should be connected in a diagram rather than compressed into a single label such as good breathing.
You now have a way to explain an important failure of intuition: enough air in total does not establish enough useful local exchange, and successful exchange does not by itself establish tissue delivery. The next chapter asks how breathing is regulated and how the exposed airway surfaces are protected while this work continues.
Application
Create a two-region model with total ventilation eight and total perfusion eight. Compare ventilation distributions of four/four and seven/one while perfusion remains four/four. Calculate each regional ratio and the whole-model ratio. Explain what the whole-model value conceals.
Draw both endpoints: ventilation with no perfusion and perfusion with no ventilation. Follow which route still carries material out of the region. State why low V/Q should not automatically be labeled zero ventilation.
For a mixing exercise, combine three blood-volume units at oxygen content eight with one unit at content four. Calculate total oxygen amount and mixed content. Then write 350–500 words explaining why partial pressures should not simply be averaged and why an overventilated neighbor cannot be assumed to cancel every deficit.
Check your understanding: Can two lungs in a model have the same total ventilation and perfusion but different regional matching?
Expected answer: Yes. The totals do not reveal how the flows are distributed. A model with one underventilated and one overventilated region can share the same whole-model ratio as evenly supplied regions while producing different gas-exchange consequences.