Coordinating with the gut and liver
Imagine that two research sessions produce closely matched blood-glucose profiles. In one, glucose arrives through the mouth and intestine. In the other, researchers adjust an intravenous infusion to imitate the measured glucose profile. Must insulin secretion be the same? If the pancreas responded only to the glucose concentration in a blood sample, we might expect it to be. Human experiments show why that model is incomplete.
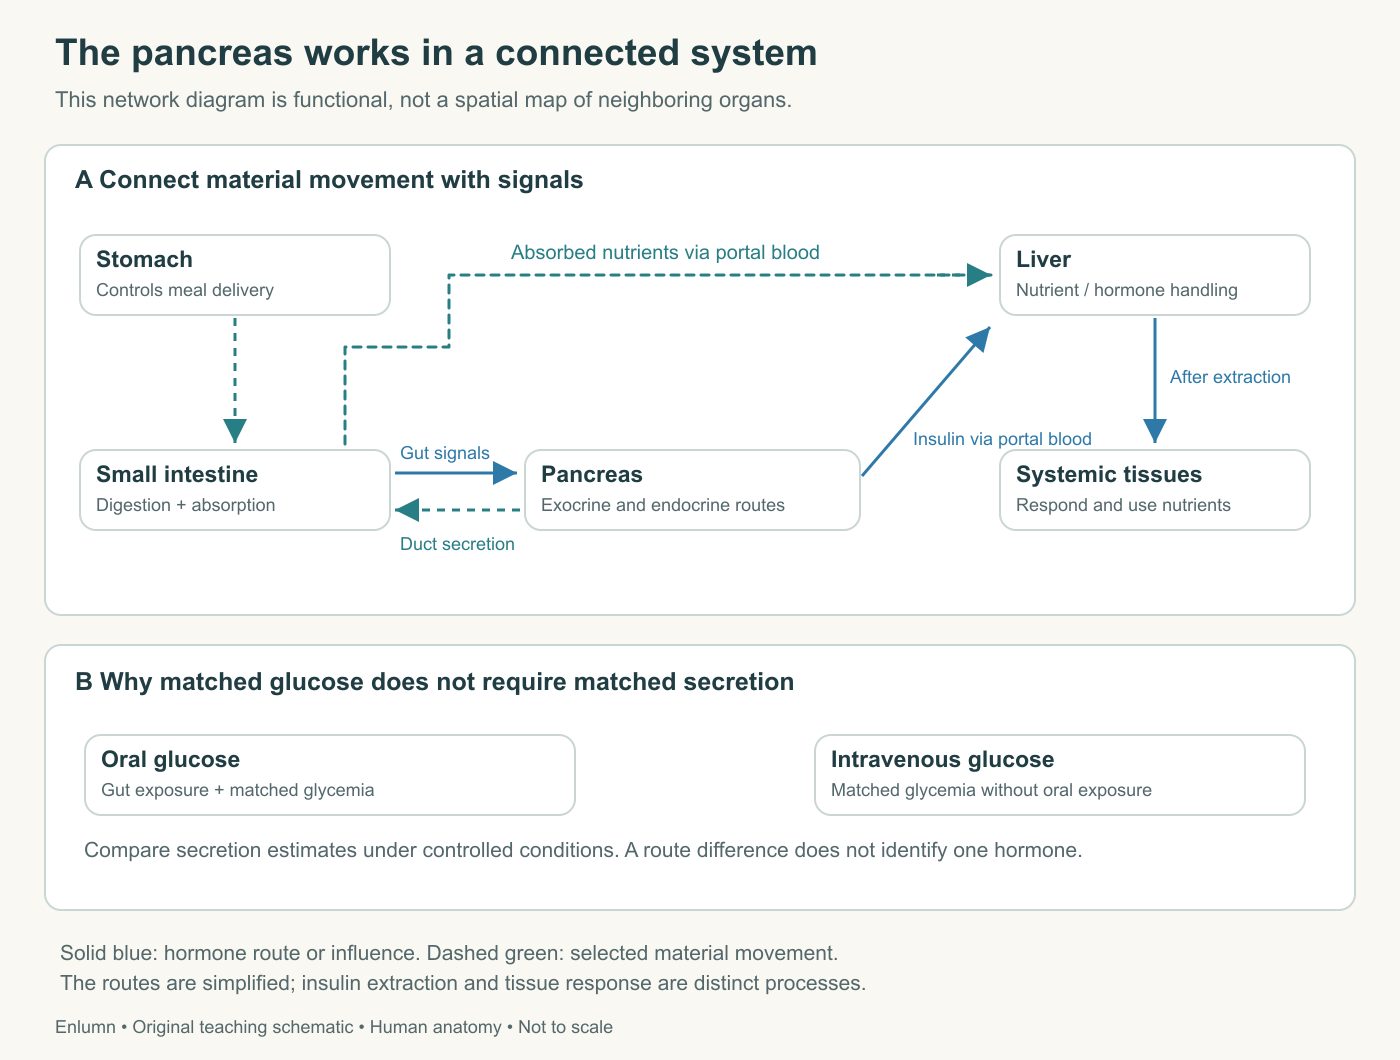
The network separates selected material routes from hormonal influences. Insulin is itself a material molecule, but its blue route emphasizes the signal whose delivery is altered by hepatic extraction. The green intestinal route represents selected absorbed nutrients entering portal blood; it does not include the initial lymphatic route of most long-chain dietary lipids. The experimental comparison below matches measured glycemia while changing oral exposure. It identifies a question about route-associated effects, not a complete explanation by one hormone. Neither box is a protocol for a reader to perform, and equal glucose profiles should not be confused with equal amounts administered by each route.
The route of arrival carries information
The gut is both a passage for nutrients and a source of signals about their arrival. Enteroendocrine cells release hormones in response to contents of the intestinal lumen. Neural pathways also connect the gut with the pancreas and other organs. Some of these responses begin before a large nutrient load appears in the systemic circulation. The body's response can therefore contain information about how nutrients arrived, not just their current measured concentration.
Two important gut hormones are glucose-dependent insulinotropic polypeptide, or GIP, and glucagon-like peptide-1, or GLP-1. They help augment insulin secretion in a glucose-dependent manner. Their broader actions and patterns of release differ, so they should not be treated as two names for one substance. For this course, the relevant point is that gut-derived information modifies the beta-cell response within a larger meal-associated system.
The incretin effect describes the greater insulin secretory response associated with oral glucose compared with an intravenous glucose exposure designed to match glycemia. This is a comparison between routes under a particular experimental design. It is not a percentage that applies identically to every meal, person, measurement or metabolic state. Nor does the comparison by itself identify the separate contribution of every gut hormone or neural pathway.
Notice the experimental challenge. Giving the same mass of glucose by mouth and vein would not necessarily create the same blood-glucose profile. Absorption, first-pass handling and the speed of delivery differ. Matching the relevant stimulus requires controlling the intravenous delivery against the observed glucose course. Without that control, a difference in insulin could simply reflect a difference in glucose exposure rather than additional signals associated with the route.
What a human experiment can establish
In a 1986 study by Nauck and colleagues, six young adults without diabetes received oral glucose loads of different sizes and corresponding isoglycemic intravenous glucose infusions. The researchers measured peripheral insulin and C-peptide and calculated insulin secretion using a kinetic model. The reported contribution associated with the oral route varied with the ingested load and with the measure used to estimate the response.
We are using the study's substantive abstract, not claiming to have reviewed its complete methods or raw data. Its value here is the design logic and the distinction among endpoints. A peripheral insulin curve, a C-peptide curve and a model-derived secretion estimate are not interchangeable observations. The small selected group also does not establish a universal response for all ages, conditions or mixed meals.
To reason through the design, invent two matched glucose profiles and separate response totals. Suppose the oral session has an integrated secretion estimate of 100 units and the matched intravenous session 40. The difference is 60, or 60% of the oral response. These are teaching numbers, not the study's findings. Choosing the oral response as the denominator answers a different question from saying the oral response is 150% greater than the intravenous response: 60/40 = 150%.
Both percentages are correct for the invented totals, but they describe different comparisons. A claim that a gut contribution is “150% of secretion” would misuse the second calculation. Always identify the numerator, denominator and physiological endpoint. This habit becomes especially useful when a physiological effect is summarized in a headline whose number is detached from its measurement method.
The experiment also leaves causal questions open. Oral and intravenous routes differ in more than one signal. To isolate the role of a particular hormone, additional evidence would be needed, such as a well-controlled intervention affecting that pathway. A route comparison establishes that matched glycemia alone does not fully account for the response; it does not prove that one named molecule explains the entire difference.
Portal delivery puts the liver early in the route
Insulin released by pancreatic islets enters venous drainage that reaches the portal circulation and liver. The liver responds to the hormone and removes a substantial, variable portion before the remaining insulin enters systemic circulation. Later recirculation and removal by other tissues also matter. This arrangement means a peripheral blood sample lies downstream of both secretion and intervening handling.
The review on measurement of insulin clearance explains why circulating insulin reflects both release and removal. We need not assign one universal first-pass percentage to understand the implication. A change in peripheral concentration can arise from altered secretion, altered hepatic extraction, altered extrahepatic removal, altered distribution or a combination. Calling every higher concentration “the pancreas working harder” skips those alternatives.
Consider two invented states. In A, the pancreas releases 100 insulin units into the relevant route and 50 are removed before systemic delivery, leaving 50. In B, secretion remains 100 but early removal is 30, leaving 70. Systemic delivery rises 40% relative to A even though pancreatic secretion is unchanged. A peripheral measurement could therefore suggest a larger secretory response unless the intervening process is considered.
Now compare C, where secretion is 140 and early removal is 70. Systemic delivery is again 70. States B and C deliver the same downstream amount through different combinations of secretion and removal. Measuring the final amount alone cannot distinguish them. This is not an obscure statistical problem: it follows directly from the anatomy and the material balance of a signal moving through successive compartments.
C-peptide helps, but it does not erase modeling
C-peptide is released alongside insulin during proinsulin processing. It undergoes much less first-pass hepatic extraction than insulin, while its distribution and removal elsewhere have different kinetics. These properties make it useful for estimating endogenous insulin secretion. However, a C-peptide concentration is still a concentration at a time and place, not a direct counter of newly released molecules.
The clearance review warns against treating the simple circulating C-peptide-to-insulin ratio as an exact measure of hepatic extraction. The two molecules have different disappearance patterns. A ratio can change when either process changes, even if the quantity we hoped to infer has not. A kinetic model tries to account for those differences, but its usefulness depends on its assumptions and the information available to estimate its parameters.
An original example illustrates the problem without copying a research model. Release equal counts of two fictional molecules into equal, fixed distribution volumes. During the next interval, 50% of molecule A remains and 80% of B remains. Their concentration ratio becomes 80/50 = 1.6 even though their release ratio was 1. A second interval with the same fractional retention gives 64/25 = 2.56. Unequal persistence changes the observed ratio over time.
Do not interpret those retention fractions as human insulin or C-peptide measurements. The example isolates one logical issue while excluding continuous secretion, multiple compartments and changing removal. Its purpose is to make the hidden assumption visible: a measured ratio represents a secretion ratio only under conditions that justify that interpretation. Better biological measurements often require a model, and a better model still requires checks.
The stomach sets part of the delivery schedule
Gastric emptying controls how meal contents reach the duodenum over time. The intestine's response can in turn influence gastric movement and secretion. CCK and other signals participate in this coordination. The result is a connected process in which downstream conditions can alter upstream delivery. The stomach does not simply empty at a fixed speed while the pancreas independently decides how much enzyme to provide.
The human exocrine secretion review describes how meal properties and the pattern of arrival affect pancreatic output. This helps explain why a mixed meal cannot be represented fully by a glucose drink. Fat, protein, physical structure and gastric handling influence the intestinal stimulus. A carefully controlled glucose experiment answers a focused question; it is not a miniature version of every dinner.
Construct a fictional schedule with 60 nutrient units delivered over an hour. In A, 45 arrive in the first half-hour and 15 in the second. In B, 30 arrive in each half. Total delivery is equal, yet early substrate availability and the timing of feedback differ. If the responding system has delays or limited capacity per interval, its trajectories can differ despite identical totals. Area under a curve and the shape of a curve carry different information.
The same reasoning applies to secretion. Coordinating enzyme delivery with substrate and bicarbonate delivery with acid requires more than matching whole-day quantities. Movement, chemical conditions and time all enter the explanation. This does not imply that ordinary digestion needs conscious scheduling; it explains the work performed by distributed physiological responses during an everyday meal.
One signal can connect several organs
Secretin and CCK were introduced through their pancreatic effects, but their role makes more sense in an organ network. Acid-related signaling helps promote bicarbonate-rich secretion. Nutrient-related signaling participates in pancreatic enzyme delivery, gallbladder contraction and changes in gastric handling. The regulation account emphasizes hormonal and neural contributions rather than a single direct controller.
A network diagram should distinguish material arrows from signaling arrows. An arrow from gallbladder to intestine can represent movement of bile. An arrow from an intestinal endocrine cell to the pancreas represents release, transport and action of a signal. If both arrows have the same style, readers may mistakenly infer that CCK flows through the bile duct or that bile instructs beta cells in exactly the same way as a receptor-binding hormone.
The liver adds another relationship. It receives newly absorbed nutrients and pancreatic signals through portal circulation and changes its own metabolic activities. It can store some incoming glucose while contributing to the handling of amino acids and lipids. Later, as intestinal delivery falls, the balance of its pathways changes. The liver course develops those intracellular routes; here their importance is that they help complete the endocrine pancreas's effects.
A strong explanation therefore has at least two linked cycles. One coordinates digestion and delivery within the gastrointestinal tract. Another coordinates nutrient availability and tissue handling through circulation. They overlap through gut hormones, absorbed substrates, neural signals and shared organs. They are neither independent systems nor one undifferentiated “metabolism” arrow. Naming the connections makes their overlap understandable.
Know what a simplified loop has left out
Return to the Chapter 3 feedback drawing. It might show glucose stimulating insulin, insulin affecting liver and muscle, and those responses altering glucose. That is a useful first loop. Add gut-derived signals, hepatic extraction and gastric delivery, and several predictions become more precise. Matched glucose need not mean matched secretion; matched secretion need not mean matched peripheral concentration; matched total nutrient intake need not mean matched timing.
More detail is not always better. A diagram containing every named hormone can become unreadable without improving the question it answers. Choose a scale and an endpoint. To explain why duct obstruction changes digestion, the duct route and luminal activity deserve attention. To explain an oral-versus-intravenous experiment, matched glycemia, route-associated signals and secretion measurement deserve attention. The best diagram preserves the links needed for the inference at hand.
One practical test is to remove an arrow and state what claim becomes unsupported. If removing the liver's extraction arrow makes you assume peripheral insulin equals secretion, the arrow is doing real explanatory work. If an extra hormone label changes no part of your argument, perhaps it belongs in a later, more detailed account. Course knowledge should improve the precision of an explanation rather than merely increase the number of labels on a page.
Check your understanding: Why does a greater peripheral insulin response after oral glucose not, by itself, quantify the extra insulin secreted by the pancreas?
Expected answer: Peripheral insulin reflects secretion plus intervening distribution and removal. A route comparison must match glycemia, and estimating secretion requires accounting for kinetics; C-peptide can help but is not a direct secretion counter.
Application
Allow 15–20 minutes. Draw a three-organ network containing pancreas, liver and intestine, with a stomach input. Use distinct arrow styles for food or secretion movement and hormonal influence. Mark hepatic insulin extraction before systemic delivery.
Analyze the invented oral/ intravenous totals of 100 and 40. Calculate both the fraction of oral response represented by the difference and the relative increase over intravenous response. Explain why the denominators differ. In 200 words, identify what the six-person study's design establishes, what its abstract does not let you check, and one additional kind of evidence needed to isolate a particular gut signal.