What makes a neighborhood?
You walk from your home to a grocery store, a park and a friend's apartment. Your route crosses a line on a statistical map, but nothing announces that you have left your neighborhood. Later, a planning document gives your area a name you rarely use. A business advertisement stretches that name several streets farther. None of these boundaries is automatically the one true boundary. They answer different questions. This course begins by asking what we mean when we treat a neighborhood as a place, a population, a network or an object of public decision.
Four maps can describe the same streets
An administrative map divides territory for a defined purpose: collecting statistics, assigning responsibility or delivering a service. A lived map follows places people use and recognize. A network map follows relationships, some local and some distant. A land-use map distinguishes activities and built forms. These maps can overlap without sharing the same boundaries.
Imagine a parent whose child attends a school across a district line, whose groceries come from a nearby commercial street and whose relatives live across the bay. The family's daily life is partly local and partly regional. Describing the home census tract is useful, but it does not contain the entire setting in which the family finds support, faces costs or encounters opportunity.
Now imagine a city deciding where to repair sidewalks. It needs a defined territory and an inventory of physical conditions. A resident describing belonging may instead emphasize a congregation, a familiar shop or the people who watch out for one another. Neither question can simply replace the other. The analyst's first responsibility is to match the boundary to the claim.
We will use San Francisco repeatedly, alongside research involving other American cities and a classic European account of metropolitan life. The aim is not to rank places by atmosphere. It is to explain how housing, movement, institutions and public space organize contact and access, while learning what different kinds of evidence can and cannot establish.
A census tract is a statistical choice
The Census Bureau defines census tracts as small, relatively permanent subdivisions of counties or equivalent areas. Their boundaries are intended to support comparison over time, but tracts can split or merge. They are not a guarantee that residents share an identity or interact closely. A tract code specifies a statistical geography, not the full meaning of a neighborhood. See the Census geography glossary's tract entry.
The distinction matters when someone says that a neighborhood's income increased. Which geography was used? Did its boundaries change? Does the figure describe households currently living inside the boundary, or the same households followed over time? A map can make an estimate look concrete while concealing uncertainty about the population to which it refers.
A small original example illustrates the boundary problem. Four blocks each contain ten households. Their household incomes, simplified here to a block mean, are 40, 40, 80 and 80 units. Grouping the first two blocks together and the last two together produces areas with means of 40 and 80. Grouping one low-income and one high-income block in each area produces two means of 60. The underlying households have not changed; the grouping has.
This is an example of the modifiable areal unit problem: patterns in aggregated data can depend on the spatial units used. It does not mean every map is arbitrary or all findings disappear when boundaries change. It means that a claim about spatial differences should identify its units and, when important, examine whether a reasonable alternative grouping changes the conclusion.
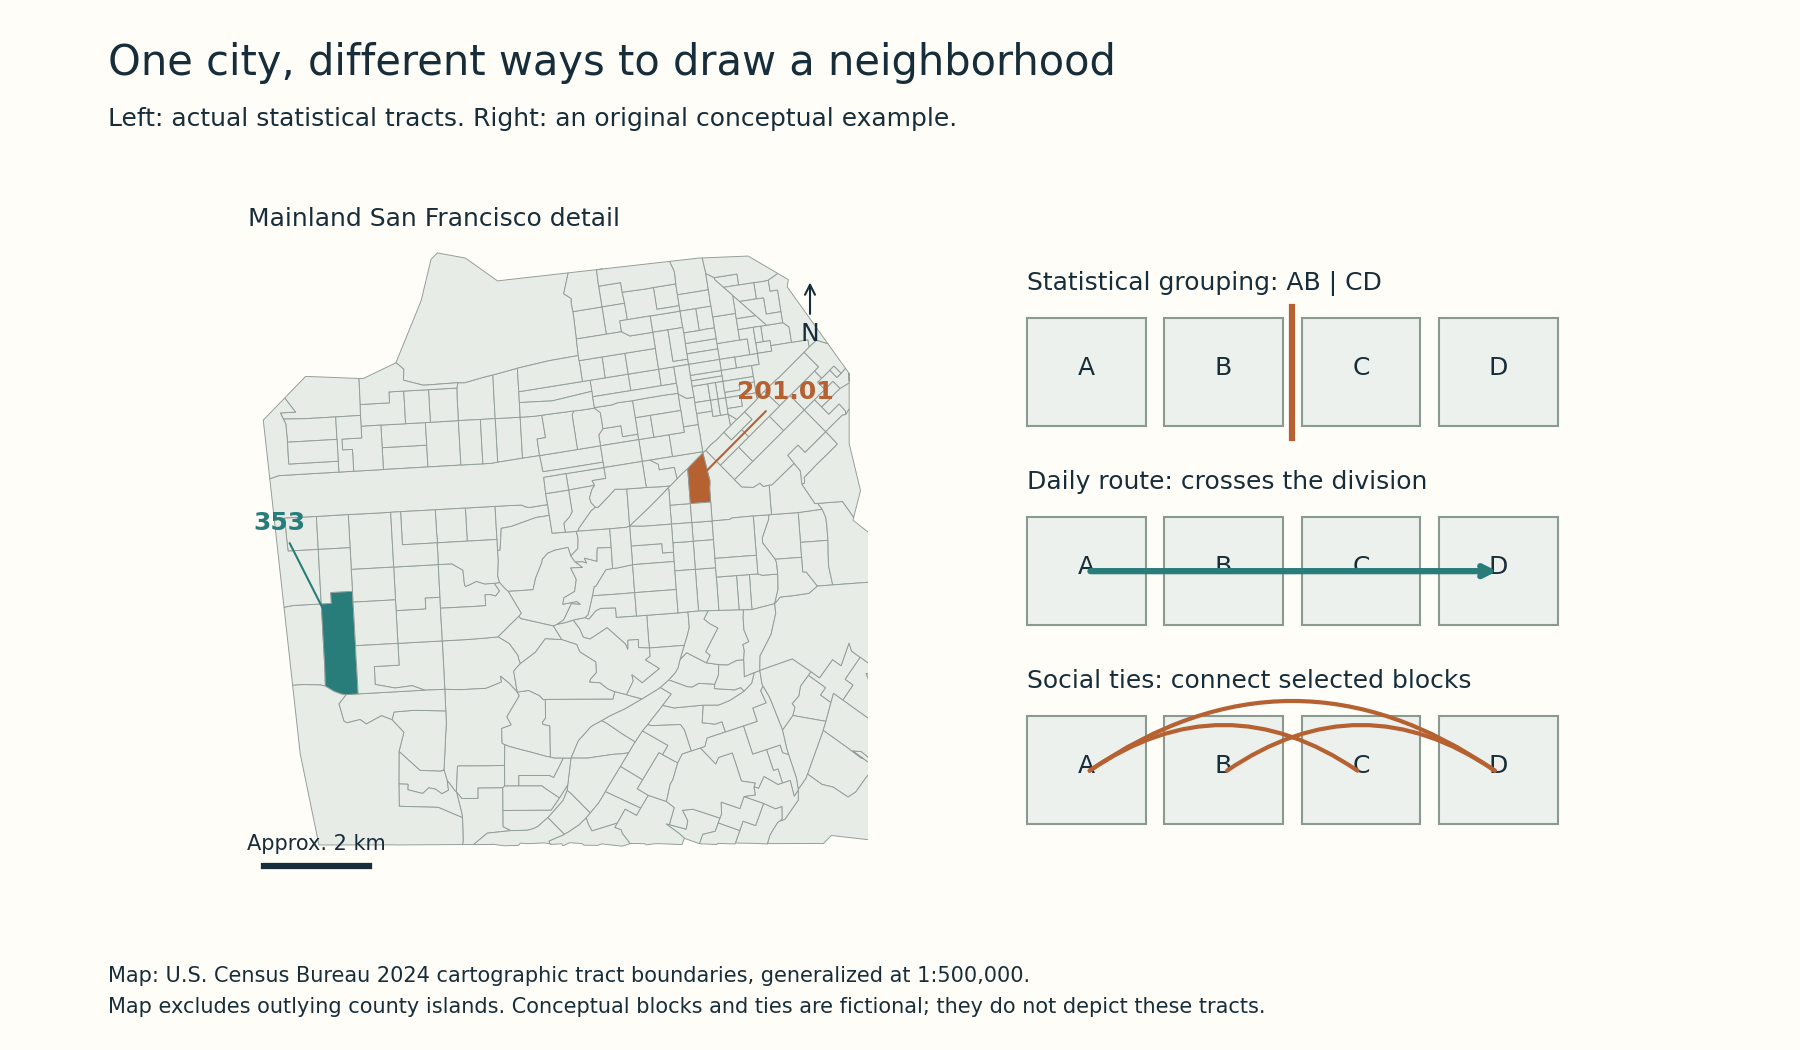
Map: U.S. Census Bureau 2024 cartographic tract boundaries, generalized at 1:500,000; mainland detail. The adjacent blocks and connections are an original conceptual example.
Proximity is not the same as connection
Two households can occupy adjacent apartments and rarely interact. Two friends can live miles apart and exchange help every week. Geographic proximity makes some encounters easier, but it does not establish a relationship. A network describes ties among people or organizations; a neighborhood boundary describes an area. Confusing them can turn a spatial concentration into an unsupported claim about community.
Consider an invented street with a hundred residents. Ten regularly organize shared activities, thirty exchange occasional greetings, and sixty have no recorded involvement in those activities. Calling the street a close community on the basis of the ten organizers may overstate the reach of their network. Calling it disconnected because most people do not attend meetings may miss quieter relationships or ties outside the street.
We need to define the tie being studied. Friendship, childcare, practical advice, business exchange and recognition are different relationships. A shopkeeper who recognizes a customer may contribute to familiarity without becoming a close friend. A neighbor willing to receive a package provides one kind of help, not evidence of agreement on politics or a willingness to lend money.
A useful network question therefore names an action or relationship and a time period. “Whom could you ask to collect a child in an emergency?” differs from “Whom did you greet this week?” Both may illuminate local life, but they should not be collapsed into a single score called community. The definition determines which connections become visible.
Read Simmel's reserve as a hypothesis
In his 1903 essay The Metropolis and Mental Life, Georg Simmel describes urban “reserve”: a distance maintained amid frequent encounters with strangers. He connects this distance both to coping with metropolitan contact and to individual freedom. The argument is a primary theoretical account, not a contemporary survey demonstrating one personality type for every city resident. Read the translated passage on reserve and freedom.
The interesting implication is that limited interaction need not mean complete social failure. A person can value living among others while declining intimacy with everyone nearby. Anonymity can provide room to pursue an unconventional life, avoid intrusive scrutiny or decide which relationships to deepen. Dense settlement and personal distance can coexist for reasons more complicated than indifference.
But the same distance can become isolation. If nobody recognizes a resident's difficulty or offers practical help, privacy may coexist with serious unmet need. The theoretical distinction asks us to investigate circumstances rather than assign one moral meaning to every brief encounter. Is distance chosen, imposed, temporary or connected to exclusion from local institutions?
An observer cannot reliably answer those questions by watching someone walk alone. Solitude in one public moment does not establish loneliness, absence of relationships or a preference for privacy. Simmel supplies a way to think about a tension; evidence about particular lives must come from appropriately designed research. Theory becomes useful when it sharpens questions without pretending to have already answered them.
Land use organizes possible encounters
A street containing homes, shops, workplaces and public facilities creates different reasons to be present at different times. A street dominated by one activity may have a more concentrated daily rhythm. These arrangements influence opportunities for encounter, but they do not determine what people feel or how they treat one another.
In a fictional comparison, Street A has a school, apartments and evening restaurants. Street B contains offices that close at six. Counting pedestrians at eight in the evening could reveal a difference in use, but it would be misleading to generalize that count to the whole day. A noon count might produce another pattern. Time is part of the geography of access.
Physical connections matter too. A park across a busy road may be close in straight-line distance and difficult to reach. A steep route, an inaccessible crossing or an interrupted sidewalk can change practical access without changing the distance on a map. A useful account distinguishes proximity, travel effort and the conditions required to use a destination.
For our final comparison, you will therefore choose a defined route or public space and record the conditions under which you examine it. The observation should describe visible features and uses. It should not infer residents' income, motives or identities from appearance. A map can organize observation, but careful observation also tells us what the map leaves out.
Neighborhoods are connected through a region
Housing, employment and transportation often operate across local boundaries. A person can live in one city, work in another and rely on family support in a third. A change in one location may affect choices elsewhere. Treating each neighborhood as a sealed container can miss those relationships.
Suppose a fictional employment center adds jobs while nearby housing remains difficult to obtain. Some workers may commute farther, share housing or seek work elsewhere. The consequences depend on wages, travel options, household needs and the housing available across the region. The local workplace change does not have a single inevitable residential outcome.
Likewise, a neighborhood's popular amenities can draw visitors who do not live there. A crowded commercial street is not a direct count of resident demand. A quiet residential block can support people whose work and social life occur elsewhere. To explain a place's daily population, distinguish residents, workers, visitors and people passing through.
These distinctions also matter for denominators. A rate calculated per resident may be inappropriate for events generated by a large daytime population. A public-space count divided by the number of nearby households may not measure how often those households use it. The correct denominator follows the process being studied, not whichever population figure is easiest to obtain.
A name can become a claim
Neighborhood names carry history, identity and sometimes economic value. A boundary used in a property advertisement may differ from one used by a community organization. An official analysis area may combine places residents distinguish. The disagreement can reveal different purposes, not simply one side's geographical ignorance.
In a supplied example, a developer calls a project part of a prestigious district, while residents identify it with a less expensive adjacent area. The name may influence expectations about price or amenities. To establish an actual effect, we would need evidence about decisions and comparisons, not merely the existence of competing labels. Still, recording who uses each name is a useful first step.
Names can also claim representation. A group speaking “for the neighborhood” may represent active members rather than every resident. Its contribution can be valuable without being statistically representative. Meeting attendance, survey responses and elections are different forms of participation, each with its own inclusion rules and limitations.
A serious analysis asks who had an opportunity to participate, who actually did and how dissent was recorded. A unanimous meeting can coexist with disagreement among people unable to attend. Conversely, one outspoken critic does not establish that a whole area rejects a proposal. The scale of the evidence should match the scale of the claim.
The objection: are boundaries too unstable to study?
If lived neighborhoods vary from person to person, a critic might ask whether neighborhood research is possible at all. It is possible because a study can define a boundary for a particular purpose and remain explicit about what that definition omits. Precision does not require discovering an eternal line that settles every question.
For a housing comparison, fixed statistical tracts can provide reproducible units. For a study of access to a park, walking routes and crossing conditions may be more relevant. For a study of mutual help, relationships may extend beyond either boundary. The problem arises when findings from one design are silently translated into claims requiring another.
An excellent study may use more than one geography. It can report tract-level estimates, map practical routes and examine how residents describe their own area. Agreement among them strengthens some interpretations; disagreement identifies questions. A statistical boundary cutting through a dense network is not an error in the network. It is evidence that the two maps describe different arrangements.
This approach also avoids treating community as something that can simply be maximized. Close ties can offer support and impose obligations or exclusion. Anonymity can provide freedom and leave needs unnoticed. The aim is to explain the arrangements and their consequences, then state the values used to judge them. Description alone does not select one preferred form of neighborhood life for everyone.
Establish a comparison contract
Before comparing places, write a short contract with yourself: the units, time window, population, measures and question. For this course's supplied numerical comparison, the units will be two named San Francisco census tracts using the same 2020–2024 ACS five-year release. They will serve as reproducible small-area windows, not as complete representations of all the neighborhoods around them.
Our comparison will distinguish household income from rent, reported estimates from uncertainty and a period estimate from a current asking price. Historical examples and public-space observations will add different kinds of information. They will not be used to invent individual biographies from a table or to imply that one tract's figures represent every nearby street.
You can already see why a good urban explanation needs patience. The place, population and relationships do not line up perfectly. Rather than treating that as a nuisance to erase, we will use it to improve our questions. The next chapter examines the most consequential boundary for many residents: the conditions under which they can obtain and keep a home.
Check your understanding: The same forty households produce area means of 40 and 80 under one grouping and 60 and 60 under another. What changed, and what does the example warn against?
Expected answer: The spatial grouping changed while the households did not. Aggregated differences can depend on the chosen units. State the boundaries and test important claims against reasonable alternatives rather than treating one map as a direct description of every person's circumstances.
Application
Allow twenty-five minutes. Draw four small maps of a familiar area: an official or statistical boundary, an everyday route, a set of relevant relationships and a land-use sketch. If you cannot inspect a real map, use the four-block fictional example instead.
Write 250–350 words explaining one agreement and one mismatch among the maps. State which map would help answer a question about housing, public-space access or mutual help. Do not identify private individuals or infer their characteristics from appearance.
A strong response makes the question determine the unit. It can explain why a nearby destination may be hard to reach, why a relationship can cross a boundary and why the same official area can contain different experiences of belonging.