How researchers find things out
The question chooses the evidence
A manager at our fictional learning center wants to know whether registration is working. She proposes a survey. Before writing questions, we need to know what working means. Does she want to know how long visitors wait, whether they understand priority rules, why some abandon an application, or whether appointments cause a change in enrollment? A questionnaire could contribute to some of these questions while leaving others largely unanswered.
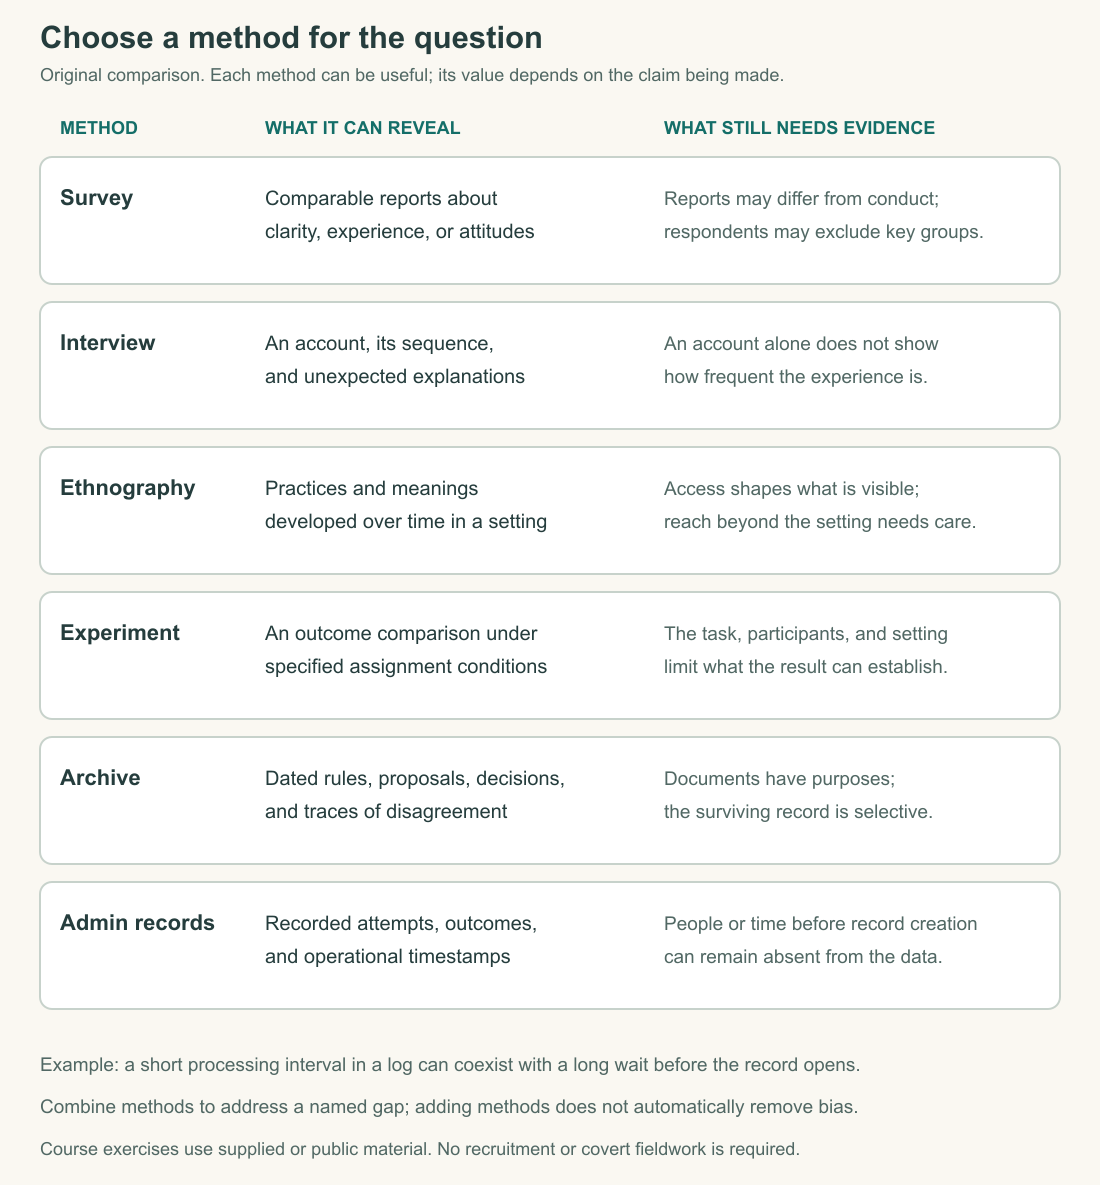
A research method is a way of obtaining and examining evidence. The choice matters because evidence is produced through a process. A registration log records certain events; an interview records answers in a conversation; an experiment introduces a comparison under specified conditions. Calling all three data does not erase how each came into existence.
OpenStax's research-methods overview introduces surveys, field research, experiments, and analysis of existing material. We use those as a coverage map, not a ranking from weak to strong. The following learning-center designs are original examples showing why a method can be well suited to one question and poorly suited to another. OpenStax, Research Methods
A survey makes answers comparable
Suppose the question is whether visitors understand which queue to join. A survey can ask many people a consistently worded question and record their answers in a comparable form. That consistency helps us count responses, compare groups, or examine change. But it only helps if the question addresses the intended concept and the people answering are relevant to the question.
Consider this original draft: Were registration and the staff helpful and fair? A yes could mean that the employee was helpful despite an unfair rule, that the rule was fair despite confusing instructions, or that the respondent simply wants to finish. The item combines several judgments. We would not know which judgment changed if the proportion answering yes increased next month.
For understanding the queue, a narrower item would be: On your most recent registration visit in the past thirty days, how clear were the instructions about which queue to join? Offer very clear, somewhat clear, somewhat unclear, very unclear, no instructions noticed, and no registration visit in that period. This is an original teaching item, not a validated questionnaire. Its final options keep absence of exposure separate from an unfavorable evaluation.
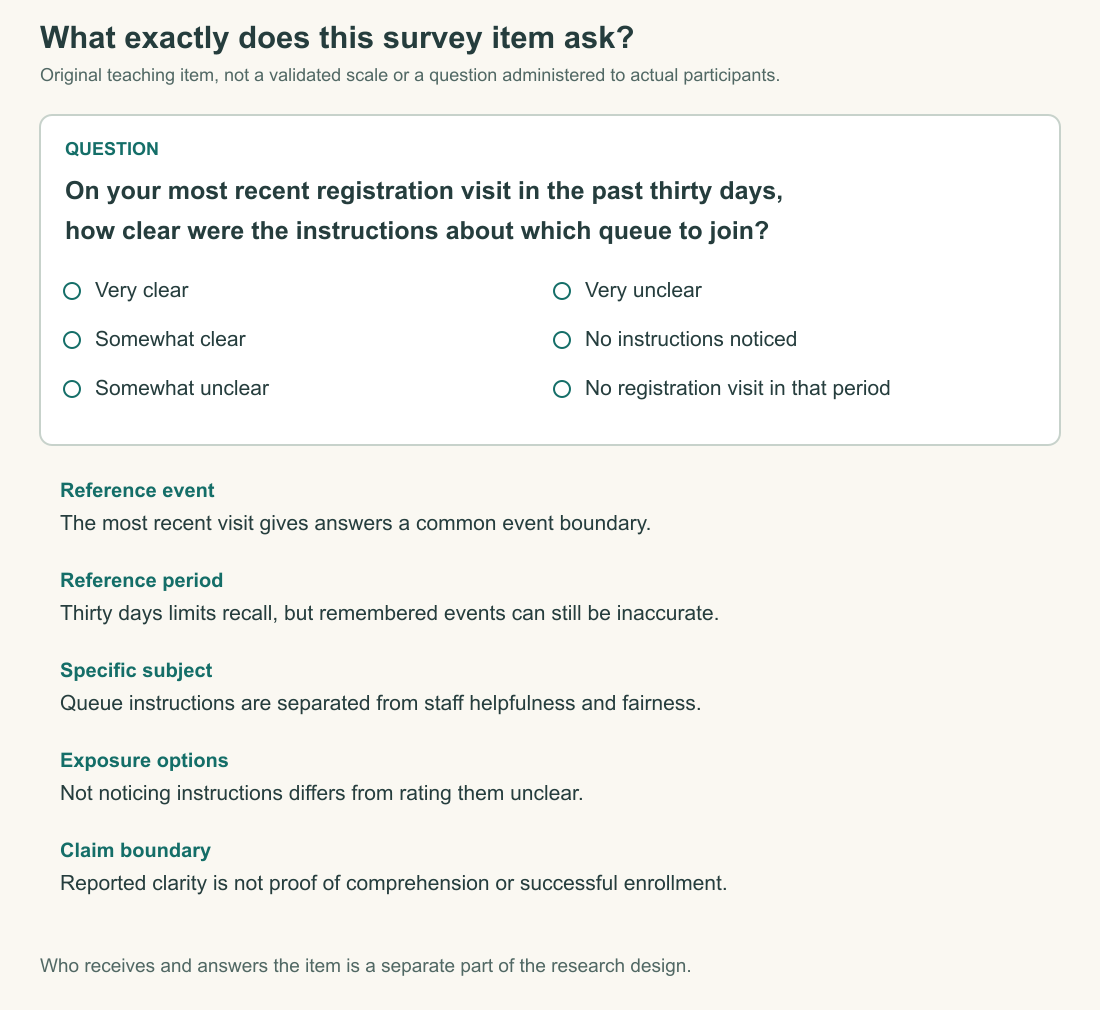
Even the revised question measures reported clarity, not demonstrated understanding. A person may find an incorrect instruction perfectly clear. To investigate comprehension, we could supply a fictional rule and ask which queue a described visitor should join. That would test interpretation of supplied material, while still differing from navigating a crowded room. The method should be described at the level of the task it actually measures.
Who receives the survey is equally important. Asking only successfully enrolled students excludes unsuccessful applicants and people who never reached the counter. Sending the form by email excludes anyone whose address was not collected or no longer works. Inviting everyone to respond does not make the respondents equivalent to everyone invited. People who are pleased, angry, rushed, or uncertain may respond at different rates.
Read the documentation before the headline
A real example is NORC's 2024 General Social Survey cross-section, Release 2. Its codebook describes adults aged eighteen or older living in US noninstitutional housing, English and Spanish administration, and several survey modes. It documents sampling and weighting rather than treating the returned questionnaires as a simple census. For the happiness item HAPPY, the unweighted table records 684 answers in the highest happiness category among 3,281 substantive answers; the full table has 3,309 cases, including reserve codes. Those denominators produce approximately 20.8 percent and 20.7 percent respectively. Neither calculation is a weighted national estimate. The codebook also separates missing-answer categories and explains weights, including a nonresponse adjustment. NORC, 2024 GSS Codebook, Release 2, overview and HAPPY table
This is a document-reading exercise, not an analysis of the individual survey records. The useful habit is to preserve the chain from concept to question, answer category, denominator, and claim. When a number arrives without that chain, there is work to do before interpreting it. A polished chart cannot supply documentation that its creator omitted.
An interview follows an account
Now suppose we want to understand why a visitor abandoned registration. A fixed list of reasons might miss the important sequence. An interview can invite an account, ask for clarification, and follow unexpected details. For our invented center, an opening prompt could ask someone to describe their most recent attempt from deciding to enroll through what happened afterward.
Imagine an authorized interview in a hypothetical future study. A participant first says the form was confusing. Asked which part caused difficulty, they explain that they could complete the form but could not obtain a document before their work shift. The follow-up changes the interpretation: the obstacle concerns a deadline and document requirement, not necessarily reading comprehension. A researcher who ticks confusing form and stops loses that distinction.
The answer is still an account produced in a particular conversation. A participant may forget an event, protect a relationship, or explain a decision differently after seeing its outcome. The interviewer may unintentionally suggest that staff mistreatment is the expected answer. Asking whether an employee was rude before asking what happened can frame the rest of the exchange. Recording the actual question helps later readers assess that influence.
An interview can establish that someone offered an explanation and help reconstruct a process. It does not automatically establish the frequency of that experience across all applicants. If we deliberately interview people who faced unusual difficulties, their accounts may be especially informative about failure points. They are not thereby a representative estimate of how often registration fails.
Ethnography follows a social process
Some questions concern practices that participants find difficult to summarize because they perform them routinely. How do staff recognize a returning visitor? How do newcomers discover unwritten exceptions? Ethnographic work can examine such activity over time through sustained engagement, observation, conversations, and relevant documents. It is more than watching strangers briefly and attaching cultural explanations to their gestures.
For the center, an openly arranged study might follow several registration cycles, observe training and handovers, and compare how a rule works during quiet and crowded periods. The duration matters because an unusual morning can look normal to someone who has seen only that morning. Repeated presence can also reveal how participants revise an explanation or make exceptions that a formal interview did not anticipate.
Access shapes the result. A researcher admitted only to the public counter may miss the meeting where allocation decisions are made. Someone introduced by a manager may receive different accounts than someone trusted by dissatisfied applicants. These conditions do not automatically invalidate the work. They belong in its explanation of how evidence was obtained and which parts of the process remained inaccessible.
A serious ethnographic account can develop and challenge causal explanations by following sequences, comparing situations, and examining contrary cases. Its limitation is not simply that it has too few people to count. The question is whether the observed material supports the particular claim and its proposed reach. A well-supported account of how an exception is negotiated does not become a national estimate by being detailed.
An experiment creates a comparison
Suppose we want to know whether a clearer instruction sheet improves understanding. In a proposed exercise with consenting volunteers, we could randomly assign one of two sheets describing the same fictional registration rules, then give everyone the same interpretation task. Random assignment makes the version received independent of participants' choices by design. It helps separate the sheet's effect from preexisting differences between people who might otherwise choose different versions.
The outcome must remain precise: correct answers to the supplied task. This would not directly measure actual enrollment, long-term learning, or treatment at a public counter. Nor would volunteers drawn from one class automatically represent every potential center user. Random assignment addresses how groups are formed within the experiment; random sampling concerns how participants are selected from a population. One does not guarantee the other.
A published example is Marianne Bertrand and Sendhil Mullainathan's 2004 study of responses to fictitious résumés. The experiment used newspaper advertisements in selected job categories in Boston during July 2001–January 2002 and Chicago during July 2001–May 2002. Names chosen to signal perceived racial identity were assigned randomly within résumé-quality groups. Table 1 reports 2,435 résumés in each name category, with callback rates of 9.65 percent for White-sounding names and 6.45 percent for African-American-sounding names. The difference is 3.20 percentage points, approximately 50 percent relative to the lower rate. The design supports an effect of the assigned name signal in this setting. It measures callbacks rather than job offers or wages, and names can convey information beyond perceived race. Newspaper recruitment in these cities and dates does not represent every hiring channel or present-day labor market. Bertrand and Mullainathan, American Economic Review
A strong experiment can therefore yield a narrower conclusion than its title might suggest to a hurried reader. That is a reason to read the methods and outcome definition, not a reason to disregard experimental evidence. Our course exercises use supplied material; reading a field experiment is not an assignment to send deceptive applications or experiment on people using a service.
Archives preserve selected traces
Return to the historical question: why were eight seats reserved? An archive might contain earlier catalogs, meeting minutes, correspondence, or successive handbooks. These documents can establish what was recorded at particular times. Comparing versions may reveal when a requirement appeared, which alternatives were proposed, and how decision makers publicly justified a change.
A document is also an action in a setting. A budget request may emphasize efficiency because its writer is seeking funding. Minutes may record decisions without preserving disagreement. A public announcement may simplify a complicated compromise. Reading critically means asking who made the document, for whom, when, and for what purpose. It does not mean assuming every official record is a deliberate deception.
Survival is selective. If the center retains approved proposals but discards unsuccessful ones, an archive may make decisions appear less contested than they were. An absent complaint is not proof that nobody objected. Yet absence can become evidence when a reliable process would normally have produced and preserved the missing record. We need to understand that process before giving silence much weight.
For a manageable document study, define the material before reading only the examples that fit. We might examine every publicly available handbook version from a specified period and record changes using the same categories. A folder of striking quotations is not equivalent to a systematic comparison of the available record.
Administrative records follow an operation
Registration databases are built to help an organization perform work. They may contain timestamps, completed forms, course assignments, and cancellations. Such records can be valuable because they describe transactions across many days without asking people to remember each event. Their categories, however, were chosen for an operational purpose that may differ from our research question.
Suppose a timestamp is created when an employee opens a record. Subtracting it from the completion time measures a recorded processing interval. It does not include time spent waiting before the record exists. If another employee opens records earlier, apparent processing times may lengthen without any change in visitor experience. The number has changed meaning through a change in workflow.
A missing transaction can mean that nothing happened, that something happened outside the system, or that the record was lost. We need a description of when records are created, updated, and removed. Counting every row as a different person can also exaggerate participation if someone makes several attempts. A reliable analysis preserves the distinction among people, applications, visits, and seats.
Combine methods around a specific gap
Methods complement one another when they answer different parts of a question. A log could identify when registration attempts stop; an interview could explore the sequence leading to abandonment; a handbook could establish the stated requirement. Agreement among them can strengthen a particular account. Disagreement may be even more informative if it reveals that they describe different populations or stages.
Imagine the log shows short processing times while interviewees describe long waits. The first response should not be to average those claims. They may refer to different intervals: time inside the record system and time before it. Once the measurement boundary is clear, the apparent contradiction can become a more complete description of the process.
A modest research design usually needs one main method and a clear account of what it cannot establish. Adding interviews, surveys, and experiments to every proposal can make the work impossible without fixing the central weakness. Choose the evidence that bears most directly on the question, name the gap that remains, and explain what additional work would be needed to cross it.
Application
Allow about twenty-five minutes. Match each question to a main method and state one limitation:
- When did the center first introduce the eight-seat reservation?
- How do staff describe the circumstances in which they hold a place for a returning visitor?
- Does changing the wording of a fictional instruction sheet improve performance on a supplied comprehension task?
- How many recorded registration attempts ended without enrollment last month?
Then inspect the linked GSS codebook's HAPPY entry and identify which denominator excludes reserve codes. Explain why its unweighted percentage is not automatically a population estimate. You do not need to download respondent data.
A strong response uses dated documents for the introduction question, interviews for staff accounts, a properly designed comparison for the instruction task, and records with a clear attempt definition for the transaction count. It notes, respectively, missing historical documents, accounts versus conduct, task performance versus actual access, and attempts absent from the system. The codebook exercise succeeds when you can locate the table and explain the denominator choice, rather than merely copy a percentage.