What does it mean to trust?
You ask a friend to collect a package while you are away. You also rely on the postal service to deliver it, the building's entry system to work and the seller to send what you ordered. If the package disappears, saying that you have “lost trust” leaves the most important question unanswered: trust in whom, to do what, under which conditions?
Trust becomes sociologically interesting when people must rely on conduct they cannot fully observe or control. That reliance can concern a familiar person, a stranger, an organization or the people currently running an institution. These are related relationships, but one measure cannot automatically stand for all of them. A person who trusts a friend may distrust a government agency without being inconsistent.
Our task is to turn a broad word into a set of answerable questions. We will distinguish the object of trust, the expected conduct and the evidence available. Then we will inspect a real survey codebook whose apparently simple percentages change meaning when we change the denominator.
Expectations have an object
In the package example, you may believe that your friend intends to help but often forgets appointments. That is a concern about reliability, not necessarily honesty. You may believe the seller can deliver a good product but is willing to conceal defects. That is a concern about intentions rather than competence. A single favorable-or-unfavorable rating can hide the difference.
Consider three original questions about a fictional transit agency. Will it operate the announced timetable? Will it distribute service fairly? Will it admit and correct an error? These ask about performance, fairness and accountability. Someone could answer yes to the first and no to the other two. Averaging the answers into a general score might be useful for some purpose, but it would discard information needed to explain the pattern.
A further distinction concerns the institution and its current leadership. A respondent may support the existence of a public transport authority while distrusting its present directors. Another may admire individual staff while objecting to the institution's rules. A survey about confidence in the people running an institution should not be retold as a referendum on whether the institution should exist.
Time also matters. Trust can concern one transaction or an expectation extending across many encounters. A promise kept once is evidence, but its significance depends on how difficult the promise was, what incentives applied and whether the circumstances resemble the next occasion. People can rationally revise expectations when those conditions change without becoming generally cynical.
Reliance is not always endorsement
Suppose a resident continues riding a bus despite expecting delays. Perhaps there is no affordable alternative. The observed behavior establishes reliance on the service, but not confidence in its quality. Counting passengers would be a poor way to measure approval unless we understood their alternatives and reasons for using it.
The reverse also occurs. Someone may trust the agency and rarely ride because the available routes do not match their journeys. Nonuse is not automatically distrust. The connection between an attitude and behavior passes through opportunity, need and cost. This is why a survey and an administrative usage record can disagree without either being false.
Trust can also be supported by safeguards. A person may agree to a transaction because there is a receipt, a review process and a remedy if something goes wrong. These arrangements reduce the amount of personal knowledge required. They do not eliminate every risk, and the safeguards themselves depend on people and institutions performing their roles.
Imagine two repair shops with equally honest owners. One keeps clear records and offers a usable dispute process; the other relies on verbal assurances. A customer who knows neither owner has different reasons for confidence in the two settings. An institutional explanation examines those arrangements rather than assuming that every trust judgment is a direct reading of personal character.
A real question and its limits
The General Social Survey includes a variable called TRUST. Its question contrasts whether most people are trustworthy with whether one should be cautious in dealing with them. The phrase “most people can be trusted” leaves the reference group broad. The 2024 GSS codebook, Release 2 also includes confidence questions about the people running named institutions, including Congress. These are different objects and response scales.
The codebook warns that TRUST is sensitive to administration mode and documents separate web-form variants. Its tables are explicitly unweighted frequencies. They are useful for examining coding and denominators; they are not ready-made national prevalence estimates. The 2024 survey concerns adults in noninstitutional housing in the United States, with a mixture of administration modes. A claim about all people everywhere would exceed that population before any calculation began.
The wording presents a conceptual puzzle. Trusting many people and exercising reasonable caution are not logical opposites. Someone may lend a neighbor a tool but still write down when it should be returned. A respondent's choice can depend on whether the question evokes ordinary cooperation, financial risk or encounters with strangers. This does not make the item useless; it makes interpretation part of the measurement task.
A stable question can support disciplined comparisons when sampling, administration and coding are handled appropriately. But the name TRUST is a variable label, not a guarantee that the item captures every meaning of the word. Read the actual question and documentation before interpreting the convenient short name.
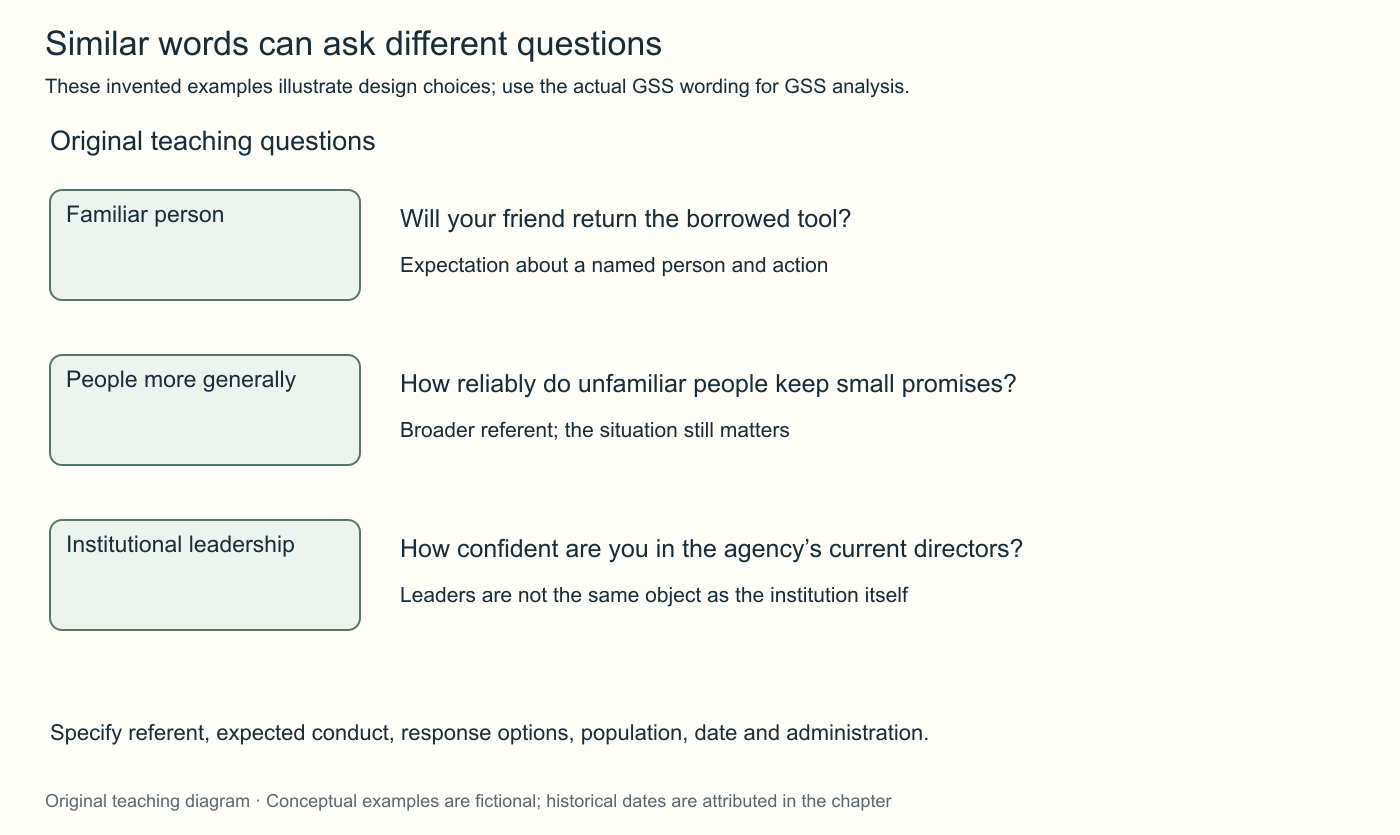
Original question-design illustration. The example questions are teaching constructions, not replacements for the GSS's exact instruments.
Work through the denominator
For the 2024 TRUST variable, the codebook records 236 responses in the trust category, 604 in the caution category and 108 in the depends category. Those substantive responses total 948. It also records seven don't-know responses, one no-answer response and 2,353 cases coded not applicable, bringing the file total to 3,309. These are actual unweighted codebook counts.
Dividing 236 by 948 gives approximately 24.9%. Dividing the same 236 by 3,309 gives approximately 7.1%. Both calculations are arithmetically correct, but they answer different questions. The first describes the share among the displayed substantive responses to this variable. The second describes the share of all file records carrying that response code.
Neither result, without the appropriate survey design and weighting work, is the proportion of American adults who trust other people. In particular, not applicable does not mean a respondent distrusts others. The item was not administered in the same form to every record in the file. Treating every reserved code as a negative answer would manufacture an attitude out of the questionnaire's structure.
An analyst must also decide how to handle depends. If it is retained as a substantive category, the denominator is 948. If someone drops it and compares only the first two categories, the denominator becomes 840 and the trust share becomes about 28.1%. That change did not come from a single person altering an opinion. It came from the analyst changing which answers count.
A good report states the coding decision and gives a reason tied to the question. It does not quietly discard an inconvenient middle category to make a trend larger. When different studies use different treatments of ambiguous or reserved responses, their percentages may not be directly comparable even if they use a similar label.
Weighting cannot repair every mismatch
Survey weights can adjust how much sampled cases contribute to a population estimate under a specified design. They are not a general-purpose cure for unclear wording, misunderstood questions or the wrong population. A perfectly weighted measure of confidence in current leaders remains a measure of that object; it does not become a measure of interpersonal honesty.
Consider an original two-group example. A survey contains fifty frequent users of a service and fifty infrequent users. Thirty frequent users and ten infrequent users report confidence, so the unweighted proportion is 40%. If the target population is 20% frequent users and 80% infrequent users, weighting the group rates gives 0.20 × 60% + 0.80 × 20% = 28%.
The adjustment is appropriate only if the population shares are relevant and the observed respondents adequately represent people within each group for the purpose at hand. If dissatisfied frequent users systematically refuse to respond, adjusting only the group's size may leave bias within it. Knowing one source of imbalance does not establish that all important sources have been corrected.
This fictional arithmetic illustrates why the codebook's frequency table is useful but insufficient for a national estimate. It also explains why an analyst should not apply a weight mechanically and stop thinking. Population definition, selection, nonresponse, item design and uncertainty remain connected parts of the inference.
Why apparent trends can disagree
Suppose one survey finds growing confidence in a named agency while another finds declining generalized trust. The findings need not conflict. People may revise judgments about that agency's performance while becoming more cautious about unfamiliar people. To call the results contradictory, we would first need to show that they measure sufficiently similar expectations in sufficiently similar populations.
Even within one item, an apparent change can have several sources. Individuals may revise their opinions. The population's composition may change. Different people may respond. The survey may switch from an interviewer to a private web form, altering how a sensitive or ambiguous answer is expressed. The task is to identify which comparisons remain defensible after these possibilities are considered.
An original example makes composition visible. In year one, a sample contains seventy people from group A, where 60% report confidence, and thirty from group B, where 20% do. The combined proportion is 48%. In year two, the proportions within each group stay exactly the same, but their shares become thirty and seventy. The combined proportion becomes 32%.
The aggregate decline is real for those changing mixtures, yet it does not show that members of either group became less confident. Whether composition is something to adjust away or part of the phenomenon depends on the question. A report about the population's overall expectations and a report about within-group change can both be valuable, provided they are distinguished.
Trustworthiness, fairness and disagreement
It is tempting to assume that more trust is always the desired outcome. But confidence in an unreliable actor can expose people to harm, while justified skepticism can prompt correction. The analytical question concerns the relationship between expectations and available evidence. The practical question concerns how institutions can become worthy of reliance and how people can recognize that quality.
A fictional agency could raise its approval rating by suppressing reports of delays. Another could publish complete information, temporarily reducing confidence while improving accountability. A rating alone cannot tell us which institution became more trustworthy. We need evidence about performance, honesty, remedies and the conditions under which people formed their judgments.
Fairness introduces values as well as predictions. Two riders may agree that the agency follows its rules consistently and disagree about whether the rules distribute service fairly. One prioritizes equal service per district; another prioritizes people with fewer alternatives. Calling one respondent mistrustful does not resolve the underlying disagreement about what the institution owes its users.
This is a reason to ask respondents about dimensions rather than relying entirely on a global score. A clear finding that people expect promises to be broken points toward a different investigation from a finding that they regard the allocation rule as unjust. The same organization may face both problems, but the mechanisms and possible responses differ.
The objection: can a survey measure such a complex relationship?
No short item can reproduce every person's complete reasoning. Yet rejecting surveys on that ground would also reject many useful measurements. The question is whether the instrument captures enough of a defined concept for a particular comparison, and whether its limitations are acknowledged. A thermometer does not describe every property of a room; that does not make temperature meaningless.
A survey can be paired with interviews that explore how respondents interpret the words, administrative records that describe performance and experiments that vary information or procedures. These sources should not be forced into agreement. If a published improvement in reliability produces no change in confidence, that may reveal weak awareness, different priorities or a history of broken promises. It does not immediately prove that the respondents are irrational.
The opposite temptation is to treat any explanation as equally plausible. Evidence can discriminate. If respondents did not know about the improvement, a theory about their deliberate rejection of it becomes less convincing. If the improvement applies only to a service they do not use, their unchanged rating may concern another part of the institution. Specific questions make these alternatives investigable.
Report the finding at its proper scale
A responsible sentence identifies who answered, what they were asked, when, how responses were handled and what kind of inference follows. It might describe a set of unweighted responses in a codebook, an estimated population proportion or a change under an experiment. These are different products, even when each ends with a percentage sign.
The final safeguard is to separate evidence of an attitude from an explanation of it. A low confidence score does not identify corruption, media influence, poor service or partisan disagreement as the cause. Those are hypotheses requiring additional observations and comparisons. The next chapter examines one important pathway: how information reaches people and changes, or fails to change, what they believe.
Check your understanding: Why do 236 TRUST responses produce both 7.1% and 24.9% in the same codebook, and why is neither automatically a national trust estimate?
Expected answer: The denominators differ: all 3,309 file records versus 948 substantive responses to this variable. Not-applicable and other reserved codes are not negative attitudes. These are unweighted counts, and population inference requires the appropriate design, weighting, item-variant and uncertainty decisions.
Application
Allow thirty minutes. Open the linked codebook and locate TRUST and CONLEGIS. Record each item's referent, response structure and reserved codes. Paraphrase their difference without reproducing the entire instrument.
Recalculate the three TRUST proportions discussed here: all records, substantive responses, and only the trust/caution categories. Write a caption for each that prevents a reader from mistaking it for the others. Then propose one original question about competence and another about fairness in a fictional institution. Explain why the answers could differ without inconsistency.