Transmitting sound mechanically
A small loudspeaker moves back and forth, yet the air beside it does not travel across the room as a package delivered to the listener. Instead, pressure variations propagate through the air while local particles oscillate. At the ear, those variations meet a membrane connected to a chain of bones and a fluid-filled inner system. To explain hearing, we must account for the transfer between these different mechanical environments. Saying that the middle ear “makes sound louder” is a beginning, but it leaves pressure, movement, and energy tangled together.
Describe a wave before assigning it a meaning
For a simple periodic pressure variation, frequency is the number of cycles completed each second, measured in hertz. The period is the time for one cycle. A fictional waveform completing 500 cycles per second has a period of 1/500 second, or two milliseconds. One completing 1,000 cycles per second has a one-millisecond period. Doubling frequency halves the period; it does not, by itself, double the pressure amplitude or the energy delivered over a chosen interval.
Sound pressure describes a variation around the surrounding pressure. An acoustic waveform going below its baseline does not imply negative absolute atmospheric pressure. A graph may label those departures positive and negative because the reference is the ambient state. That distinction resembles measuring height above and below sea level: a negative plotted value depends on the chosen zero. When reading a pressure graph, identify both the unit and the reference before interpreting its shape.
A real voice contains many frequency components changing over time. A frequency spectrum and a pressure-versus-time waveform describe different aspects of the same signal. Frequency relates to pitch, and sound level relates to loudness, but the perceptual qualities are not identical to the physical measurements. The ear and nervous system must interpret a changing pattern under particular conditions. National Research Council, Basics of Sound, the Ear, and Hearing.
Suppose waveform A contains one repeating component, while B contains that component plus another at twice its frequency. Their largest pressure excursions could be equal even though their shapes differ. A single “peak amplitude” number would then conceal a distinction that the full waveform preserves. Conversely, the same waveform stretched across a longer time axis changes its frequencies without changing its maximum plotted height. These are paper comparisons, not instructions to generate tones for a hearing test.
The outer ear changes the input pattern
The pinna and canal do more than provide an unobstructed entrance. Their geometry changes transmission across frequencies and directions. The folds of the pinna contribute spectral cues used in locating sounds, while the canal's acoustic behavior influences pressure at the eardrum. The exact effects depend on geometry and frequency. We should therefore avoid drawing the outside waveform and the eardrum waveform as necessarily identical copies. Purves and colleagues, The External Ear.
Use a fictional filter to make this concrete. Three incoming frequency components have amplitudes 2, 2, and 2. A supplied transmission model multiplies them by 1, 2, and 0.5, giving output amplitudes 2, 4, and 1. The filter changes the relative pattern even though it adds no new meaningful word or melody. A second direction might produce multipliers 1, 1, and 1.5. Comparing outputs could then provide information about direction if the observer also has relevant knowledge of the sound and filtering system.
But one output pattern rarely identifies its cause uniquely. An output of 2, 4, and 1 might result from a flat incoming signal passing through our filter, or from an already uneven signal passing through a different one. This is an inverse problem: infer an input or source from its transformed result. Additional cues, movement, experience, and comparisons can help, but the physical ambiguity remains important. An anatomical filter supplies evidence for location rather than printing the source's address on the signal.
The eardrum responds to a pressure difference
A membrane's motion depends on forces on both sides and on its mechanical properties. Pressure acting over an area contributes force, and a pressure difference across the tympanic membrane matters. A static imbalance and a rapidly varying acoustic input are different features of its environment. The auditory tube helps maintain the middle-ear environment through ventilation, drainage, and pressure regulation. It does not have to carry every acoustic cycle down to the throat for the ossicles to move. NIDCD, Ear Infections in Children.
Imagine a model membrane with an outside baseline of 100 pressure units and an inside baseline of 100. An outside acoustic fluctuation of plus or minus one unit occurs around a balanced starting point. If the inside baseline becomes 95 while the outside remains 100, a persistent difference is added. The fluctuating input has not disappeared, but it now acts on a changed mechanical state. The example does not predict an actual ear's displacement; it shows why baseline conditions cannot be ignored.
A simple spring model makes the qualification explicit. If force equals stiffness times displacement, a force of six units moves a spring of stiffness three by two distance units. Doubling stiffness to six reduces displacement to one. Yet a vibrating membrane is not only a spring: mass, damping, frequency, geometry, and connections also affect its response. The simple calculation is useful because it identifies one possible reason for changed movement without pretending to be a complete middle-ear simulation.
Pressure gain is not free energy
The middle ear helps transfer acoustic energy between air and the much higher mechanical impedance presented by the inner-ear fluid system. The effective area difference between the tympanic membrane and stapes footplate, together with ossicular mechanics, contributes to pressure transformation. “Impedance” describes how a system's motion relates to its driving force or pressure at a given frequency; it includes more than friction alone. A poorly matched interface can reflect substantial energy rather than transmit it efficiently. Purves and colleagues, The Middle Ear.
Take an ideal device with an input area of 12 square units and an output area of one. An input pressure of two force units per square unit supplies 24 force units. If that force reaches the output unchanged, output pressure is 24 units per square unit, a twelvefold pressure ratio. This is not a measured anatomical ratio. It isolates the definition pressure = force/area and demonstrates how a smaller area can experience higher pressure without creating force from nothing.
Now include an ideal lever whose input arm is twice the output arm. A 24-unit input force can balance a 48-unit output force, but the output travels only half as far. If the input moves two distance units while the output moves one, the work products are equal: 24 × 2 = 48 × 1. In a lossless model, force gain trades against displacement. Real systems also dissipate energy. The result is a reason to distrust any diagram promising multiplied pressure, multiplied displacement, and unchanged input energy simultaneously.
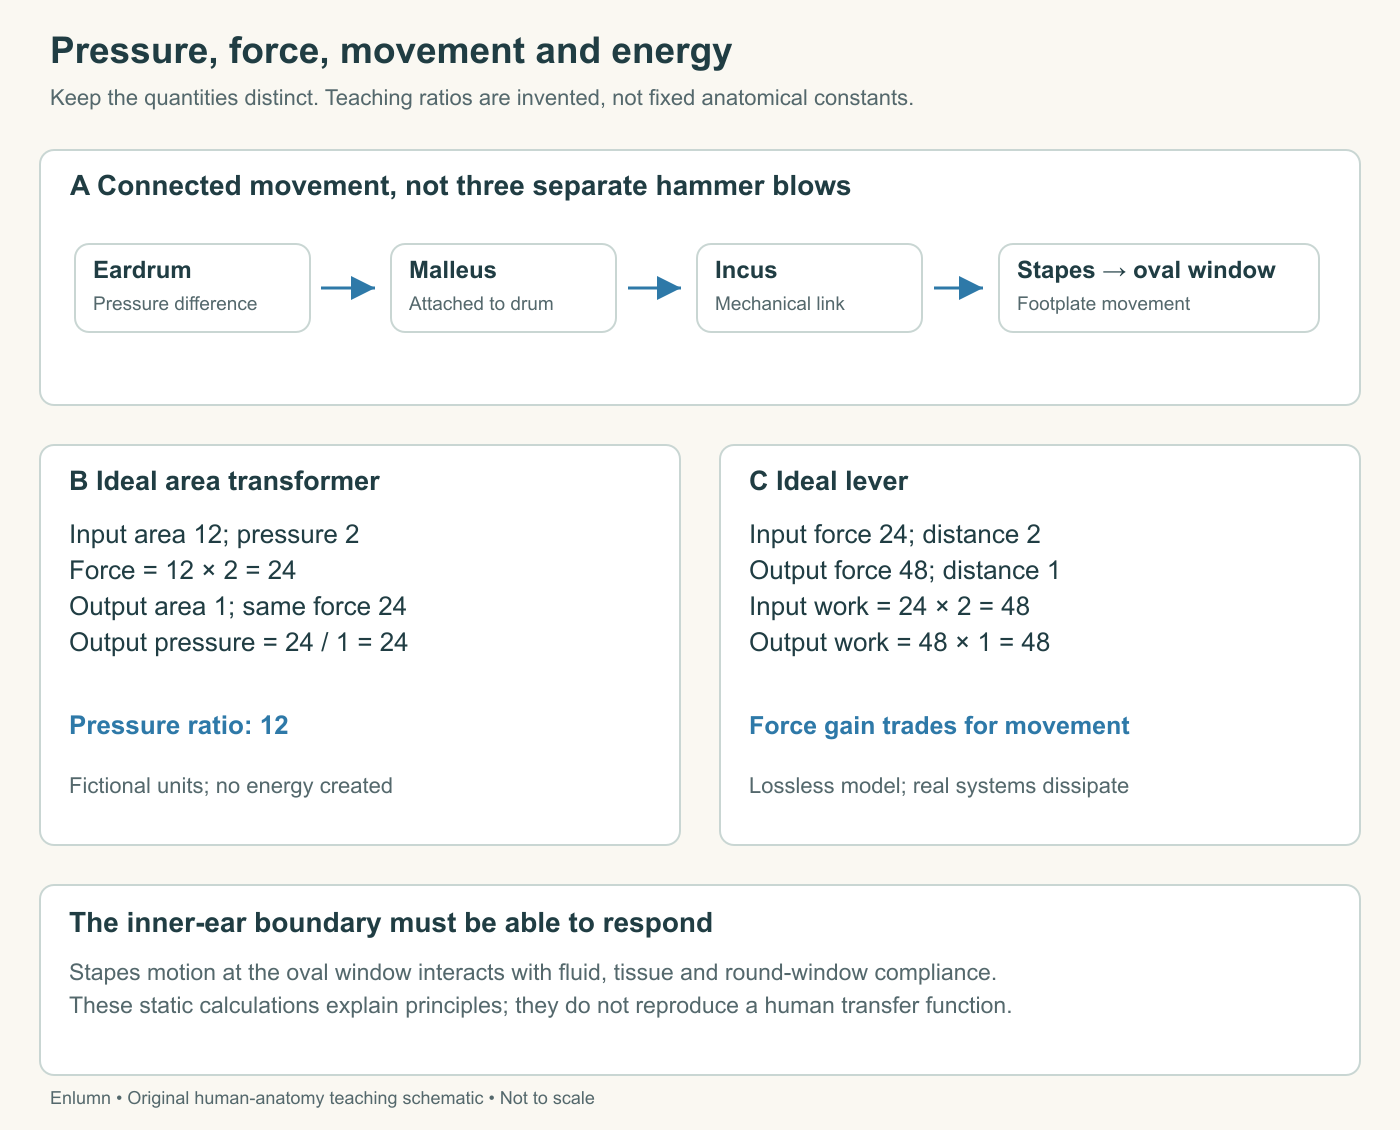
These models explain principles rather than literal rigid-piston behavior of an eardrum. The effective vibrating area can depend on the pattern of motion, and the ossicles need not move as one perfectly rigid lever at every frequency. An exact transfer function requires measurement and a model appropriate to the question. A useful introduction should preserve the energy constraint while refusing to turn convenient teaching ratios into universal anatomical constants.
Compare gain across frequency
Suppose an invented device has pressure gains of 8, 20, and 5 at three tested frequencies. A label announcing “twentyfold amplification” selects its highest value and hides the other two. If all three inputs have amplitude one, the outputs are 8, 20, and 5. If the third input rises to four, its output becomes 20 in the simple linear model. The same output amplitude can therefore arise from different combinations of input amplitude and gain.
To learn whether a changed output reflects a changed source or changed transmission, measure the input as well as the output. In the third band, an output increasing from 5 to 10 could result from doubling the input at fixed gain, doubling gain at fixed input, or several smaller changes together. A comparison that records only the final movement cannot uniquely select among those explanations. This lesson is especially valuable when an everyday word such as “hearing” is used for the entire chain.
The gain model also states its linear assumption. If output always equals gain times input, doubling the input doubles the output. Biological systems may depart from that relationship. We will meet an active, nonlinear contribution inside the cochlea in the next chapter. Keeping the passive middle-ear example separate from active cellular mechanics prevents the word “amplification” from hiding two physically different sources of behavior.
Timing belongs in a transmission model too. Imagine two identical pressure traces, except the second reaches its maximum half a cycle later. Their peak amplitudes and frequencies match, but their phases differ. At 500 Hz, half a cycle lasts one millisecond. At 1,000 Hz, it lasts half a millisecond. A delay measured in time therefore corresponds to different phase shifts at different frequencies. Recording amplitude alone would miss that relationship.
For a concrete comparison, let two hypothetical inputs each contribute a pressure departure of plus two units at one instant. Their sum is plus four. If one instead contributes minus two at that instant, the sum is zero. This is ideal linear addition at a specified location and time, not a rule that two sound sources always cancel everywhere. Different positions and reflections change the relative timing. A complete mechanical account needs the temporal pattern as well as the size of the response.
The windows set a movable boundary
Movement of the stapes at the oval window produces pressure and displacement in the inner-ear system. The round-window membrane can accommodate complementary movement. The relevant event is a changing mechanical state of fluid and tissue, not a sustained flow of outside air into the cochlea. Nor should a drawing require every sound-induced disturbance to complete a long tour through the apex before any local receptor can respond. The cochlear partition has distributed mechanical behavior.
An ideal volume balance clarifies only one aspect. If a piston of area two moves inward by 0.1 distance unit, it displaces 0.2 cubic unit. A second boundary of area four could accommodate that volume by moving outward 0.05 unit. Equal displaced volumes do not require equal distances when areas differ. The real cochlea is more complicated, but the model makes a useful prediction: locking every other boundary changes the mechanical response, even if the input piston remains present.
Presence and mobility therefore answer different questions. A photograph showing a chain of ossicles establishes that recognizable structures are there. It cannot alone establish their movement under a defined input. Likewise, a record of stapes motion does not fully describe the resulting cochlear partition motion. The next structure's load and the coupling between them matter. This is why physiology requires relationships measured during operation as well as anatomy observed at rest.
Keep numbers attached to their definitions
Sound levels often use decibels, a logarithmic way of expressing a ratio. For a pressure ratio under the appropriate same-medium comparison, the level difference is 20 log₁₀ of that ratio; an intensity ratio uses 10 log₁₀. A pressure ratio of ten corresponds to 20 dB. A pressure ratio of two corresponds to about 6 dB. These are arithmetic relationships, not declarations about how much louder any individual will perceive a sound.
In an ideal progressive wave in the same medium, intensity scales with squared pressure amplitude. Doubling the pressure gives four times the intensity, consistent with 10 log₁₀(4), also about 6 dB. The agreement depends on using compatible quantities. If someone inserts a pressure ratio into the intensity formula, the result is wrong by a factor of two in the decibel difference. No loud sound is needed to learn this; the calculation belongs entirely on paper.
A reference must also be named. Zero decibels is not a universal statement that no sound exists; it means equality to the selected reference for that measure. Clinical hearing-level scales and sound-pressure-level scales use different reference conventions. This course does not ask you to calibrate equipment or interpret your own thresholds. It asks you to keep the physical quantity, reference, and perceptual claim separate so a numerical statement remains meaningful.
Check your understanding: An ideal lever doubles output force while halving output displacement. Has it doubled mechanical work, and does this establish a twofold increase in perceived loudness?
Expected answer: No. Force multiplied by displacement remains unchanged in the lossless model. Perceived loudness is a separate outcome involving the signal and auditory system; it cannot be inferred as a fixed multiple from the lever's force ratio.
Application
Allow 20 minutes. For a fictional area transformer, use input area 15, output area 3, and input pressure 4. Calculate input force and output pressure assuming unchanged force: 60 force units and 20 pressure units. Explain why a fivefold pressure increase does not mean fivefold energy creation.
Next, compare three supplied gains, 3, 6, and 2, applied to input amplitudes 4, 1, and 5. The outputs are 12, 6, and 10. State which band has the highest gain and which has the highest output, and explain why these differ.
Finish by annotating the ossicle diagram with “pressure,” “force,” “displacement,” and “energy transfer.” Include the round window and one sentence distinguishing baseline cavity pressure from acoustic oscillation. Do not produce test tones, force pressure changes in your ears, or use household equipment as a hearing test.