One journey through two circuits
Suppose the right ventricle pumps five liters in a minute and the left ventricle also pumps five liters. Has the heart sent ten liters through the body? The arithmetic looks obvious until you draw the route. The two ventricles do not supply two independent halves of the body. They work at different places in a connected circulation, moving blood through successive parts of a loop.
This chapter turns the chamber map into a route you can reconstruct from any starting point. We will follow one imagined red blood cell, distinguish its journey from the movement of oxygen, and then account for the flow of the whole circulating volume. The numbers are assigned teaching examples. They let us test an explanation without requiring measurements from a person.
Begin wherever you can close the loop
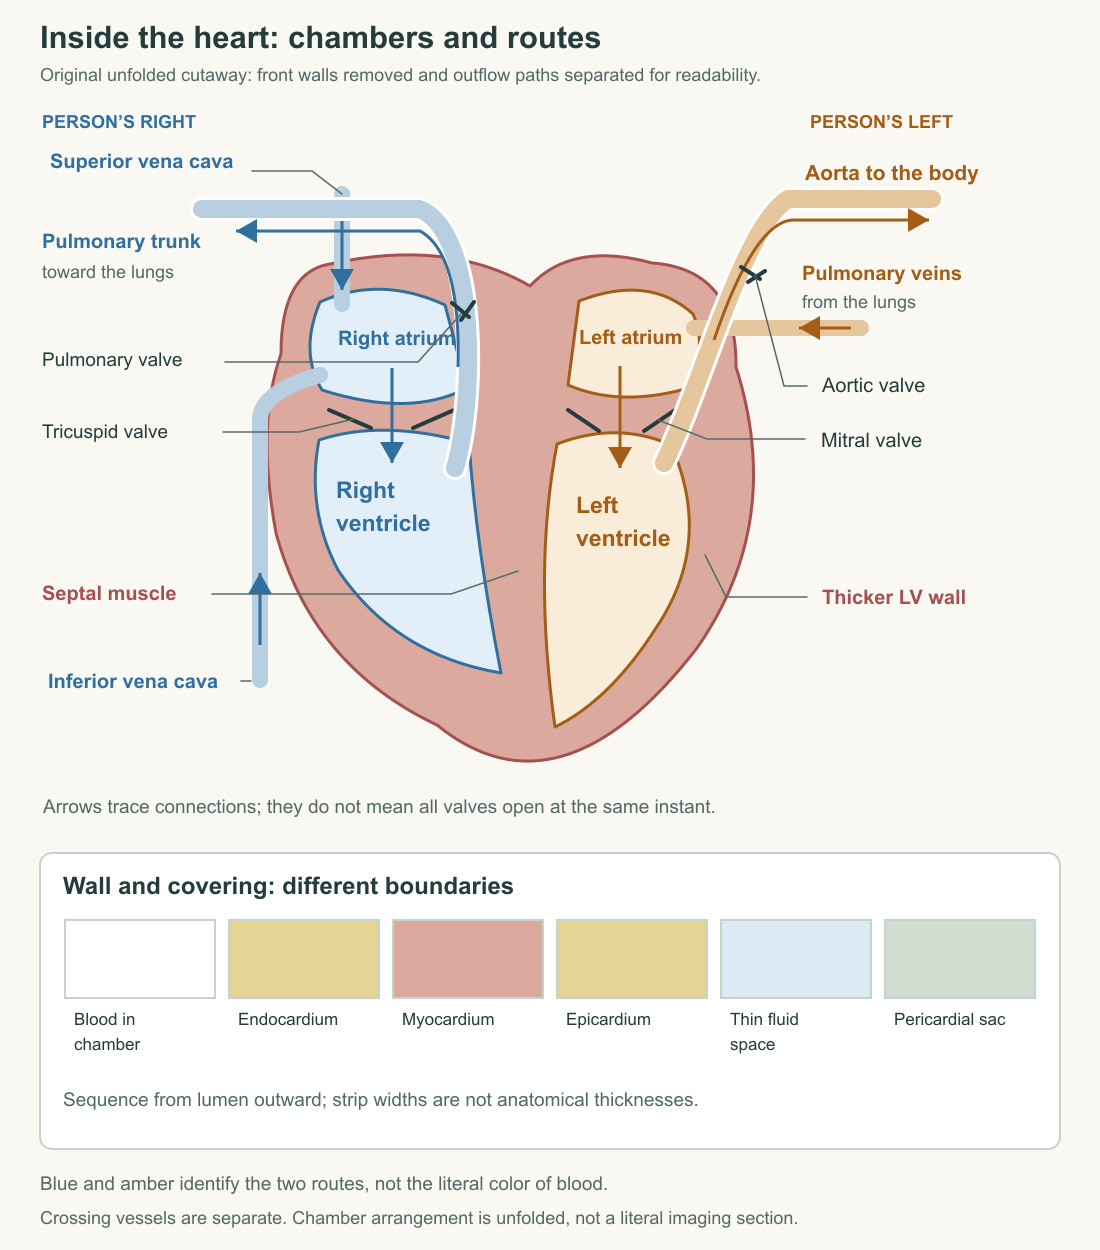
Choose a red blood cell returning from a leg through the inferior vena cava. It enters the right atrium, passes through the tricuspid valve into the right ventricle, and leaves through the pulmonary valve into the pulmonary trunk. Branches of that trunk lead toward the lungs. After traversing the pulmonary exchange vessels, the cell returns through a pulmonary vein to the left atrium.
Next it passes through the mitral valve into the left ventricle. Ejection carries it through the aortic valve into the aorta. A systemic arterial branch takes it toward a body region; smaller vessels lead into an exchange network, then collecting veins return it toward the right atrium. The University of Minnesota's physiology route provides the chamber-and-valve sequence. We are tracing the usual main adult circulation, not every small connection or developmental arrangement.
The chosen starting point was a convenience. You could begin in a pulmonary vein or a systemic artery and still recover the same loop. If changing the starting point changes which valve comes after the right ventricle, the map contains a mistake. A route is defined by connections, not by the first item in a memorized list. An exchange network includes many small pathways; one drawn line stands for a region, not a single universal vessel.
Use four checkpoints: tricuspid follows right atrium; pulmonary follows right ventricle; mitral follows left atrium; aortic follows left ventricle. These identify openings without yet explaining their timing. An arrow through a valve means that passage occurs during the appropriate part of the beat, not that all four valves remain open simultaneously. The pressure sequence that operates them is the next chapter's subject.
Name a vessel by direction, not by a color
An artery carries blood away from the heart; a vein returns blood toward it. In the pulmonary circuit, an artery carries blood toward the lungs before oxygen uptake there, while veins return blood after that exchange. The NHLBI flow explanation makes both the direction rule and this route clear. “Artery means oxygen-rich” is therefore an unreliable definition even in the circulation we have just drawn.
Direction is defined along the vessel's route. A curved artery can briefly point toward the heart on a page while still carrying blood farther along an outward pathway. Likewise, a vein does not become an artery because an illustrator rotates it. Trace where the vessel comes from and where it leads rather than interpreting the orientation of a short line segment.
Color is a separate annotation. Blue and red in a diagram often distinguish relatively lower and higher oxygen content. They do not create two different kinds of circulating fluid, and lower oxygen does not mean none. Blood remains blood as its carried substances change. A monochrome diagram with correct labels and arrows should still permit an accurate route explanation.
Try removing color from your map and identifying the pulmonary artery and pulmonary vein from their connections alone. Then restore an oxygen annotation and explain what changes at the pulmonary exchange region. If either task requires guessing from page position, add a label or clarify a junction. The aim is a map whose meaning survives a change in artistic convention.
The cell and its cargo take different journeys
In the lungs, air occupies alveolar spaces while blood remains within nearby vessels. Oxygen crosses a thin exchange boundary and enters blood, where much of it is carried by hemoglobin in red blood cells. Carbon dioxide moves from blood toward the alveolar air. The NHLBI gas-exchange account connects these routes. The red blood cell does not need to leave its vessel and float through an air sac to collect oxygen.
At a systemic tissue, the same distinction returns. Oxygen can leave the blood and reach cells while the red blood cell continues along the vascular route. A whole-cell arrow and an oxygen arrow should therefore diverge at an exchange region. If your drawing sends the red blood cell into a muscle cell merely because oxygen enters that cell, it has confused carrier with cargo.
Consider an original diagram with two traces. The solid trace follows the red blood cell through the entire circulation. A dotted trace follows one oxygen molecule after it enters pulmonary blood, travels to a tissue, and is used in cellular chemistry. There is no requirement that this molecule complete the red blood cell's loop as unchanged oxygen. The circulation recirculates a carrier while materials can enter, leave, and undergo transformation.
This distinction prevents a second shortcut: carbon dioxide is not simply the same oxygen parcel wearing a new label. Cellular reactions connect several chemical inputs and products. A route diagram can show the net exchange of gases without claiming a one-for-one swap at every boundary. For this course, the important connection is that transport supports metabolism and removes products; the detailed chemistry is a different level of explanation.
Two circuits in series, many branches in parallel
The pulmonary and systemic circuits are connected in series: blood passing through the main route encounters them successively. Within the systemic circulation, however, many organ networks are supplied in parallel. A branch to a kidney and a branch to an arm are alternative pathways receiving portions of the outgoing flow. Blood need not visit every organ in a fixed order before returning to the heart.
Klabunde's network account also identifies an important exception to the simple parallel picture: intestinal venous drainage reaches the liver through the hepatic portal route. That arrangement will matter in the liver and digestive courses. Here it shows why “most organ networks are parallel” is useful and “every organ is connected in exactly the same way” is not.
Build an original three-branch model with total flow of five liters per minute. Assign one liter to branch A, one and a half to B, and two and a half to C. The branch flows sum to five. None individually receives the full five liters per minute. On the return side, they combine again. The accounting is unchanged if the three branches are drawn above one another, side by side, or around a circle.
Now increase A from one to two liters per minute while holding the total at five. B and C together must fall from four to three. Alternatively, their flows could remain unchanged if total inflow increased to six. The drawing alone cannot tell you which occurs. You must state what is held constant. Physiological regulation can alter both total output and distribution; a conservation statement limits the possibilities without selecting the mechanism.
This is the difference between an identity and a cause. The sum of branch flows equals total flow in the steady model because material is accounted for. That equality does not explain which vessel changed its resistance or which signal changed cardiac activity. Later we will add those mechanisms to a map whose bookkeeping already works.
Why the outputs cannot drift apart indefinitely
Return to the two ventricles. In an idealized closed loop at steady state, the time-averaged output of one side must match the flow reaching and leaving the other. Otherwise, blood volume would progressively accumulate in one part of the circuit and diminish elsewhere. Klabunde's venous-return explanation distinguishes this balance from temporary differences during changing conditions.
Use two fictional reservoirs connected by two pumps. Pump R transfers five liters per minute from reservoir S to reservoir P. Pump L returns only four liters per minute from P to S. In one minute, P gains one liter and S loses one. Repeat the assumed rates for three minutes and the transfer totals three liters. Nothing has been created: the same total volume has been redistributed.
That calculation does not predict that an actual heart could maintain those rates for three minutes. Changing volumes and pressures would affect the pumps and the connected vessels. The model exposes why a permanent mismatch needs an explanation; it does not supply the body's response. A conservation argument is strongest when its limits are stated along with its result.
When both modeled pumps move five liters per minute, adding their outputs gives ten liters of pump passage per minute, counted across two stations. It does not give ten liters per minute delivered to the systemic branches. The distinction is like counting the same travelers at two successive checkpoints: a sum of crossings and a number of travelers passing one checkpoint answer different questions.
Nor does five liters per minute tell you the total volume present. A flow is an amount crossing a boundary per time. An inventory is the amount within a boundary at a moment. If a fictional loop holds four liters and carries two liters per minute, dividing gives a nominal turnover time of two minutes. That quotient does not mean every cell returns at exactly two minutes; different paths, mixing, and local residence times can produce different journeys.
Delivery requires both flow and what the blood carries
A route can be open and flowing while the amount of a carried substance changes. Pittman's account of circulation and oxygen transport links bulk movement to local exchange. To quantify delivery, specify both blood flow and oxygen content. The first tells you how much blood arrives per minute; the second tells you how much oxygen arrives with each unit of blood.
Take an assigned arterial oxygen content of 160 milliliters of oxygen per liter of blood, with five liters of blood arriving per minute. Delivery is 800 milliliters of oxygen per minute. If returning blood contains 120 milliliters per liter at the same flow, it carries away 600 milliliters per minute. The difference is 200 milliliters per minute removed from blood in the modeled tissue circuit.
Write the units through the multiplication: liters of blood per minute multiplied by milliliters of oxygen per liter of blood. The blood-volume unit cancels, leaving an oxygen amount per minute. The two quantities both use volume units, but they refer to different substances. Dropping the labels makes an apparently simple calculation much harder to interpret.
At steady state with no changing oxygen stores, that difference can represent tissue oxygen consumption. If oxygen is accumulating in or leaving a store, the balance needs an additional term. These assigned values are not a clinical range or a prescription. They demonstrate why delivery, extraction, and consumption must be distinguished before comparing measurements.
Now reduce the assigned incoming oxygen content to 128 milliliters per liter while retaining five liters per minute of flow. Delivery becomes 640 milliliters per minute. Restoring delivery to 800 would require 6.25 liters per minute at that content, if the model permits it. This algebra does not establish that a particular body can or should make that adjustment. It identifies the quantities a physiological explanation must connect.
Put the heart's own tissue back into the map
Coronary circulation supplies the heart wall as part of systemic distribution. Much of its venous return reaches the right atrium through the coronary sinus; other venous paths also exist. The coronary-sinus anatomy reference describes that collecting route. The blood supplying the pump is not a third independent circulation that somehow avoids the main return pathway.
Our two-loop picture remains a deliberate simplification. For example, lung tissues also receive systemic supply through bronchial vessels, described in the circulatory-pathways reference. Small connecting and drainage routes complicate an exact accounting. The elementary balance applies to the stated idealized loop; it should not be presented as proof that every actual flow measured at every location is numerically identical.
The useful picture is now richer than two colored halves. It contains connected circuits, parallel branches, local exchange, a living pump with its own supply, and quantities that balance across chosen boundaries. One important piece is still missing. Arrows say where blood goes, but they do not make it move. To explain movement, we must connect muscle activity to pressure differences and watch the valves respond through a beat.
Application
Starting in a pulmonary vein, trace a red blood cell back to the same type of vessel. Include all four chambers, all four valves, a systemic exchange region, and a pulmonary exchange region. Mark where oxygen can leave or enter the blood without sending the red blood cell across the exchange barrier.
Model route: pulmonary vein → left atrium → mitral valve → left ventricle → aortic valve → aorta → systemic arterial branch → systemic exchange network → venous return → right atrium → tricuspid valve → right ventricle → pulmonary valve → pulmonary trunk and arteries → pulmonary exchange network → pulmonary vein. The chosen systemic branch determines the specific return route; not every branch must pass through the inferior vena cava.
In a fictional steady loop, each ventricle moves four liters per minute. Two systemic branches receive 1.2 and 0.8 liters per minute. What remains for a third branch? If incoming oxygen content is 150 milliliters per liter and returning content is 110, what are delivery and net removal?
Model calculation: the third branch receives two liters per minute. Systemic delivery is 4 × 150 = 600 milliliters of oxygen per minute. Return is 4 × 110 = 440, so net removal is 160. Adding ventricular outputs would double-count passage through the two pump stations. Calling the 160 removal “consumption” additionally assumes steady oxygen stores in the modeled tissue circuit.
Finally, change one pump to 4.4 liters per minute and leave the other at four for an assigned ten-second interval. Model interpretation: the intervening compartment gains 0.4 × 10/60 = 0.0667 liters, about 67 milliliters, while another loses that amount. The calculation predicts redistribution under the assigned rates, not a diagnosis or a sustainable state of an actual heart.