How muscle becomes a pump
A ventricle can be developing force without ejecting any blood. That seems paradoxical if “contraction” means simply squeezing the contents out. It becomes understandable when we put a valve at the entrance and another at the exit. The wall can raise the pressure of an enclosed volume before either opening permits movement. Pressure, volume, and flow are related quantities, but they need not change together.
We will follow that relationship through one idealized beat, concentrating on the left ventricle and its mitral and aortic valves. The right side follows corresponding principles at different pressures. First we need to connect the organ's muscular wall to events inside its cells. Otherwise, “the heart squeezes” simply replaces the mechanism with a familiar gesture.
Force begins below the scale of a chamber
Cardiac muscle contains repeated contractile units called sarcomeres. Within them, actin-containing thin filaments and myosin-containing thick filaments interact. Shortening changes their overlap; it does not require each filament to shrink. Neighboring cardiac muscle cells are connected at intercalated discs, with structures supporting mechanical attachment and gap junctions permitting electrical communication. The cardiac-muscle reference describes this organization. A working wall needs both forces and connections through which they can act together.
An electrical event at a working muscle cell's membrane triggers changes in calcium handling. Calcium entry through membrane channels helps trigger calcium release from an intracellular store, the sarcoplasmic reticulum. Calcium binding to troponin changes the regulation of actin–myosin interaction. This is excitation–contraction coupling: an electrical event is linked to mechanical activity through intervening cellular processes. Klabunde's coupling account supplies that connection without making voltage and force the same thing.
The molecular cycle uses ATP. Myosin heads attach, generate movement through their cycle, detach when fresh ATP binds, and become prepared for further interaction as ATP is hydrolyzed. The cross-bridge explanation describes the basic actin–myosin sequence. ATP is not merely a signal announcing that a cell should contract. Its chemical turnover participates in the operation of the machinery.
Relaxation also depends on cellular work. Calcium must fall in the cytosol; ATP-dependent uptake into the sarcoplasmic reticulum contributes to that change, alongside routes removing calcium from the cell. Reduced activation allows force to decline. An organ that relaxes between beats has not necessarily run out of fuel. The cycle requires controlled activation and recovery, supported by continuing energy supply.
These steps give us several possible measurements: electrical activity, intracellular calcium, muscle force, and chamber movement. A change in one may influence the next, but one trace is not a direct measurement of all four. That distinction will become central when we reach the ECG. For now, it explains why cellular activity can precede observable ejection.
A valve responds to its surroundings
The mitral valve lies between left atrium and left ventricle. Its leaflets move within a supporting apparatus, including chordae tendineae attached to papillary muscles. The human papillary-muscle account identifies their role in preventing the leaflets from prolapsing into the atrium during ventricular systole. The cords are not little handles that pull the valve open to admit blood.
The aortic valve has a different arrangement, with semilunar cusps rather than an equivalent set of papillary-muscle tethers. The valve-anatomy account distinguishes the structures. Keeping both valves as identical hinged doors may be sufficient for a first flow diagram, but it is insufficient for explaining how their tissues bear load.
For a simple pressure model, treat each competent valve as opening for a forward pressure difference and preventing sustained reverse flow. Compare pressure on its two sides. The mitral comparison is atrium versus ventricle; the aortic comparison is ventricle versus aorta. Neither valve senses a universal clock reading and decides that its scheduled turn has arrived.
Real leaflets and moving blood have inertia, and opening or closure takes time. Our discrete snapshots omit those details. The simplification is useful because it reveals the ordering of events. It would become misleading if we used it to claim that every instant of real flow must follow a static comparison with no delay or momentum.
Fill, then develop pressure at nearly fixed volume
During ventricular filling, left atrial pressure exceeds ventricular pressure sufficiently to drive blood through the open mitral valve. Much filling can occur before atrial contraction, with atrial systole contributing later in ventricular diastole. Atrial and ventricular phase names therefore need to be distinguished: an atrium can contract while its ventricle is still in its filling phase. The cardiac-cycle account introduces these relationships.
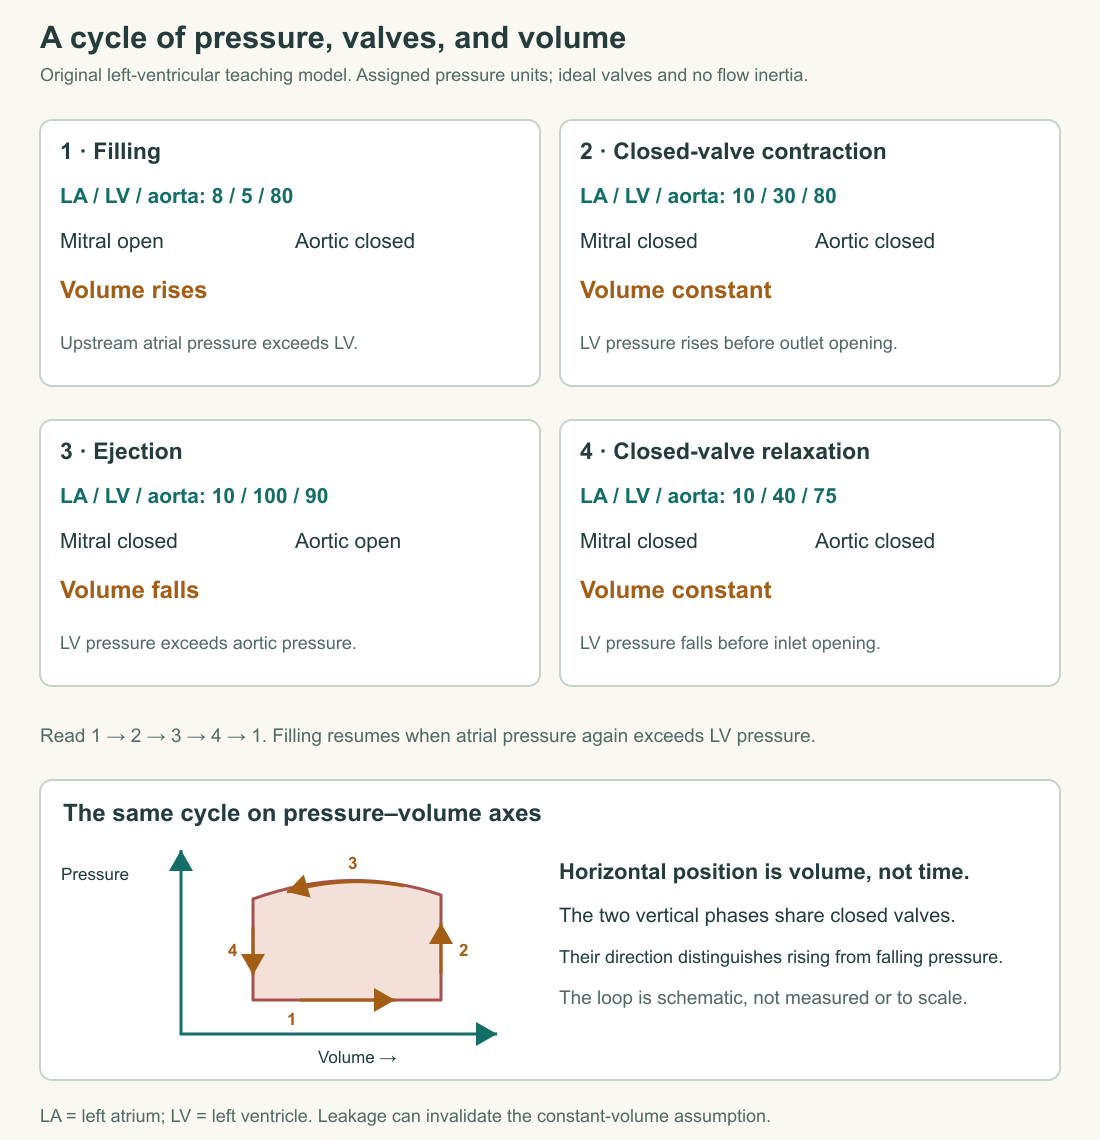
Take an assigned snapshot with atrial pressure 8, ventricular pressure 5, and aortic pressure 80, all in the same illustrative pressure units. The atrium-to-ventricle difference favors filling. The aorta-to-ventricle difference would favor reverse flow through an unguarded outlet, so the competent aortic valve remains closed in our model. One ventricle can have an open inlet and a closed outlet without a contradiction.
Now let the ventricular wall develop force. Ventricular pressure rises above atrial pressure, closing the mitral valve. Suppose a later snapshot has atrial pressure 10, ventricular pressure 30, and aortic pressure 80. The mitral valve is closed, yet ventricular pressure is still insufficient to open the aortic valve. Both valves are closed. The chamber is in isovolumetric contraction: pressure rises while cavity volume remains approximately constant.
“Approximately constant volume” does not mean the wall is motionless or metabolically idle. Local shape and tissue deformation can change while total cavity volume changes little. Imagine an enclosed flexible shape becoming rounder in one region and narrower in another. You could observe movement without a substantial change in its total contents. The volume statement concerns the chamber as a whole.
This is the first test of a pressure diagram. If the plotted ventricular pressure rises after inlet closure but before outlet opening, a nearly flat volume trace is appropriate. Drawing an immediate large fall in volume would imply an exit route the model has not supplied. The plotted lines have to agree with the valve states.
Eject, then relax before filling resumes
When ventricular pressure becomes sufficient relative to aortic pressure, the aortic valve opens and ejection begins. In our next assigned snapshot, ventricular pressure is 100 and aortic pressure 90, while atrial pressure remains much lower. Volume can fall as blood leaves through the outlet. Pressure need not increase throughout the entire ejection period; a time course can rise and then fall while ejection continues.
At the end of ejection, the aortic valve closes as the pressure-flow relationship reverses. The relaxing ventricle may still have a pressure above that of the atrium. Assign aortic pressure 75, ventricular pressure 40, and atrial pressure 10. Both valves are again closed, but now ventricular pressure is falling. This is isovolumetric relaxation.
The same two closed valves therefore occur in two different phases. To distinguish them, ask whether pressure is rising or falling and what event preceded the snapshot. A single valve-state picture cannot establish the direction of travel through the cycle. Time order supplies information that an isolated illustration lacks.
Eventually, ventricular pressure falls below atrial pressure and the mitral valve opens. Filling resumes. Atrial pressure 10 and ventricular pressure 5 favor forward entry in our final snapshot, while the outlet remains closed. We have returned to the original kind of state without assuming that every pressure or volume must have exactly its previous numerical value on every real beat.
| Assigned phase | Mitral valve | Aortic valve | Ventricular cavity volume |
|---|---|---|---|
| Filling | Open | Closed | Increasing |
| Isovolumetric contraction | Closed | Closed | Approximately constant |
| Ejection | Closed | Open | Decreasing |
| Isovolumetric relaxation | Closed | Closed | Approximately constant |
The table is an idealized model of competent valves. It deliberately leaves out transition intervals and regurgitation. Those omissions define its use: it teaches the main sequence and gives us a baseline against which a later component failure can be explained.
Change the graph without changing the beat
A time plot places time on the horizontal axis and can show several quantities together. A pressure–volume plot instead places ventricular volume on the horizontal axis and ventricular pressure on the vertical axis. Each point still comes from a moment in the beat, but time is no longer an axis. Klabunde's pressure–volume explanation connects the two representations.
In the pressure–volume view, filling moves toward greater volume, isovolumetric contraction moves upward at nearly fixed volume, ejection moves toward lower volume, and isovolumetric relaxation moves downward. The path forms a loop. Put arrows along it. Without arrows, the reader cannot tell whether a vertical segment represents pressure rising or falling.
Assign an end-diastolic volume of 140 milliliters and an end-systolic volume of 80. The difference, 60 milliliters, is stroke volume in this competent-valve model. The ventricle has not emptied: 80 milliliters remain after ejection. On the loop, the horizontal span between the two limiting volumes is 60 milliliters. On a time plot, the same result comes from subtracting the final volume from the initial one.
Ejection fraction expresses the change relative to the starting volume: 60 divided by 140 is about 0.43, or 43 percent. This assigned result is an exercise in defining a ratio, not a clinical interpretation. A second model with volumes 100 and 40 ejects the same 60 milliliters but has an ejection fraction of 60 percent. Equal stroke volumes can therefore produce different fractions because the denominators differ.
Conversely, equal fractions need not mean equal outputs. Volumes 120 and 60 give a fraction of one-half and a stroke volume of 60. Volumes 80 and 40 also give one-half but a stroke volume of 40. A ratio is useful when you know what it compares. It does not replace the underlying amounts, heart rate, pressure, or the question of whether the ejected volume travels forward effectively.
The pressure needed for ejection also depends on the outlet the ventricle faces. In two original pump models, let each chamber develop a pressure of 50 units. Model A faces an outlet pressure of 40; model B faces 60. The same chamber pressure can open A's ideal outlet valve while leaving B's closed. “Pressure reached 50” is therefore incomplete evidence of pumping success. You need the pressure on the other side of the valve. This also explains why the right ventricle's connection to the pulmonary circulation cannot be analyzed by copying the left ventricle's assigned aortic pressures. The phase logic transfers, but the loading conditions do not become identical.
Flow beyond the heart can continue between ejections
Closing the aortic valve does not make arterial pressure instantly vanish. The aorta and other elastic arteries deform during ejection and subsequently recoil. This compliant reservoir helps smooth the intermittent output of the ventricle. Klabunde's systemic-circulation account identifies aortic compliance as part of pulse damping. The vascular system is not a set of perfectly rigid pipes receiving isolated, motionless packets.
Consider an original reservoir model. During a short input pulse, more fluid enters an elastic chamber than leaves it, so its stored volume increases and its wall stretches. After input stops, stored elastic energy and the pressure difference can continue driving outflow while the stored volume declines. The earlier input supplied the energy. Continued downstream movement does not require the pump to be ejecting at that same instant.
That account links the cardiac cycle to the circulation chapter's time averages. The ventricle can have zero outlet flow during a closed-valve interval while a downstream region still has flow. Equality of average flows over a stable cycle does not demand identical instantaneous flow traces at all locations. Temporary storage is the missing term when the traces differ.
Listen to the event without confusing the measurement
The first two familiar heart sounds are associated with closure of the atrioventricular valves and closure of the aortic and pulmonary valves. The NHLBI heartbeat account provides that broad timing connection. A sound is a mechanical signal associated with the changing valve–blood–tissue system, not an electrical recording or a direct measurement of ejected volume.
Place a sound marker near each relevant closure event on your time diagram. It helps align observations, but it cannot replace the pressure and volume traces. Two beats could have similar closure timing while ejecting different volumes. Likewise, knowing that a ventricle developed pressure tells you less than knowing whether its outlet opened and how much blood moved through it.
The beat now has a chain of explanation: cellular activation, force in a connected wall, changing chamber pressure, valve movement, and changing blood flow. Relaxation and vascular storage are part of that chain. Next we will examine the electrical sequence that coordinates activation—and learn why an orderly electrical trace is valuable evidence without being a complete picture of pumping.
Application
Draw a four-phase left-ventricular cycle. For each phase, label the mitral and aortic valve states and the direction of change in pressure and volume. Add an arrow showing where atrial contraction contributes to filling. Then draw a separate pressure–volume loop for assigned end-diastolic and end-systolic volumes of 150 and 90 milliliters.
Model interpretation: filling has an open mitral and closed aortic valve; isovolumetric contraction has both closed with pressure rising; ejection has mitral closed and aortic open with volume falling; isovolumetric relaxation has both closed with pressure falling. Atrial contraction belongs near the end of ventricular filling, not in the middle of ventricular ejection. Stroke volume is 60 milliliters and the assigned ejection fraction is 40 percent. Neither value alone supplies a diagnosis.
Explain this fictional snapshot: atrial pressure 9, ventricular pressure 35, and aortic pressure 78, with both valves closed. Model answer: it could occur during isovolumetric contraction or relaxation. The snapshot does not tell us whether ventricular pressure is rising or falling. A neighboring time point or preceding valve event would distinguish the phases.
Finally, correct “the heart relaxes because it has used all its ATP, and then blood stops everywhere until the next beat.” Model correction: controlled calcium handling and cross-bridge cycling require energy throughout the cycle. Relaxation is not ordinary fuel exhaustion. Elastic vascular storage can support downstream flow between ventricular ejections, so local instantaneous flows need not be identical.