What filtration means
Glucose is useful fuel. Yet glucose normally enters the fluid formed at the glomerulus. That fact should unsettle the idea that a kidney's filter selects only substances the body wants to discard. The initial transfer is governed by a barrier and physical forces. What happens afterward depends on the tubular route.
This chapter stops at that first transfer long enough to examine it properly. We will distinguish a filter's selectivity from the force driving flow, calculate how much of a substance enters filtrate, and ask what a measurement can establish. The objective is to explain a process, not to memorize a supposedly ideal filtration number.
Crossing a living barrier
The glomerular filtration barrier includes capillary endothelium, a shared basement membrane and podocyte foot processes with slit diaphragms between them. Podocytes form the visceral epithelial layer around the capillary loops. Fluid crossing the barrier reaches the capsule's urinary space. Blood cells and most large plasma proteins ordinarily remain on the vascular side. StatPearls: Bowman capsule and filtration layers.
The endothelium contains fenestrations, openings through the cells. These should not be imagined as empty holes punched through an inert plastic sheet. An endothelial surface coat, including the glycocalyx, contributes to the restriction of protein passage. Its role operates alongside the other barrier components and subsequent tubular protein handling. Ballermann, Nyström and Haraldsson: glomerular endothelium review.
A useful drawing has two labeled spaces and several layers between them. Place “blood plasma” on one side and “urinary space” on the other. Then draw a water molecule crossing without drawing a red blood cell following it. The distinction is selective permeability: different constituents do not cross with equal ease.
The barrier also remains living tissue. Its cells maintain their structure and interact with neighboring components. A household membrane may be replaced when damaged; a biological barrier must be maintained within a continuously operating circulation. That difference matters when considering why altered structure can affect passage even if the organ's gross outline appears unchanged.
There is no need to assign a single magic pore size to explain this introductory model. Doing so would encourage a false picture of one uniform mesh deciding everything. The important contrast is between constituents that cross readily and those strongly restricted, across an interface whose multiple components work together.
Useful material can enter filtrate
Water and many small dissolved substances pass into the initial filtrate. Tubules then recover much of that water and selected solutes, including normally filtered glucose. Filtration and recovery are successive parts of the process. NIDDK: glomerulus and tubule.
Consider a hypothetical parcel of plasma containing small dissolved molecules A and B. Suppose the barrier allows both to cross equally readily. One may later be largely recovered while the other is largely excreted. Their different final outcomes do not require the barrier to have distinguished “valuable” from “unwanted” at the beginning.
This explains why finding a molecule in the initial filtrate does not answer whether it will appear in substantial quantity in final urine. It has entered a route with additional exchange opportunities. To infer its final fate, we need the later transport rules, not just the entrance conditions.
The language of intention can obscure the mechanism. “The body decides to throw away A” gives no account of permeability, concentration, transport or flow. A stronger explanation specifies which boundary A crosses, what drives that crossing, and which downstream processes change its amount. These questions remain useful even when the body's overall regulation is serving a clear physiological function.
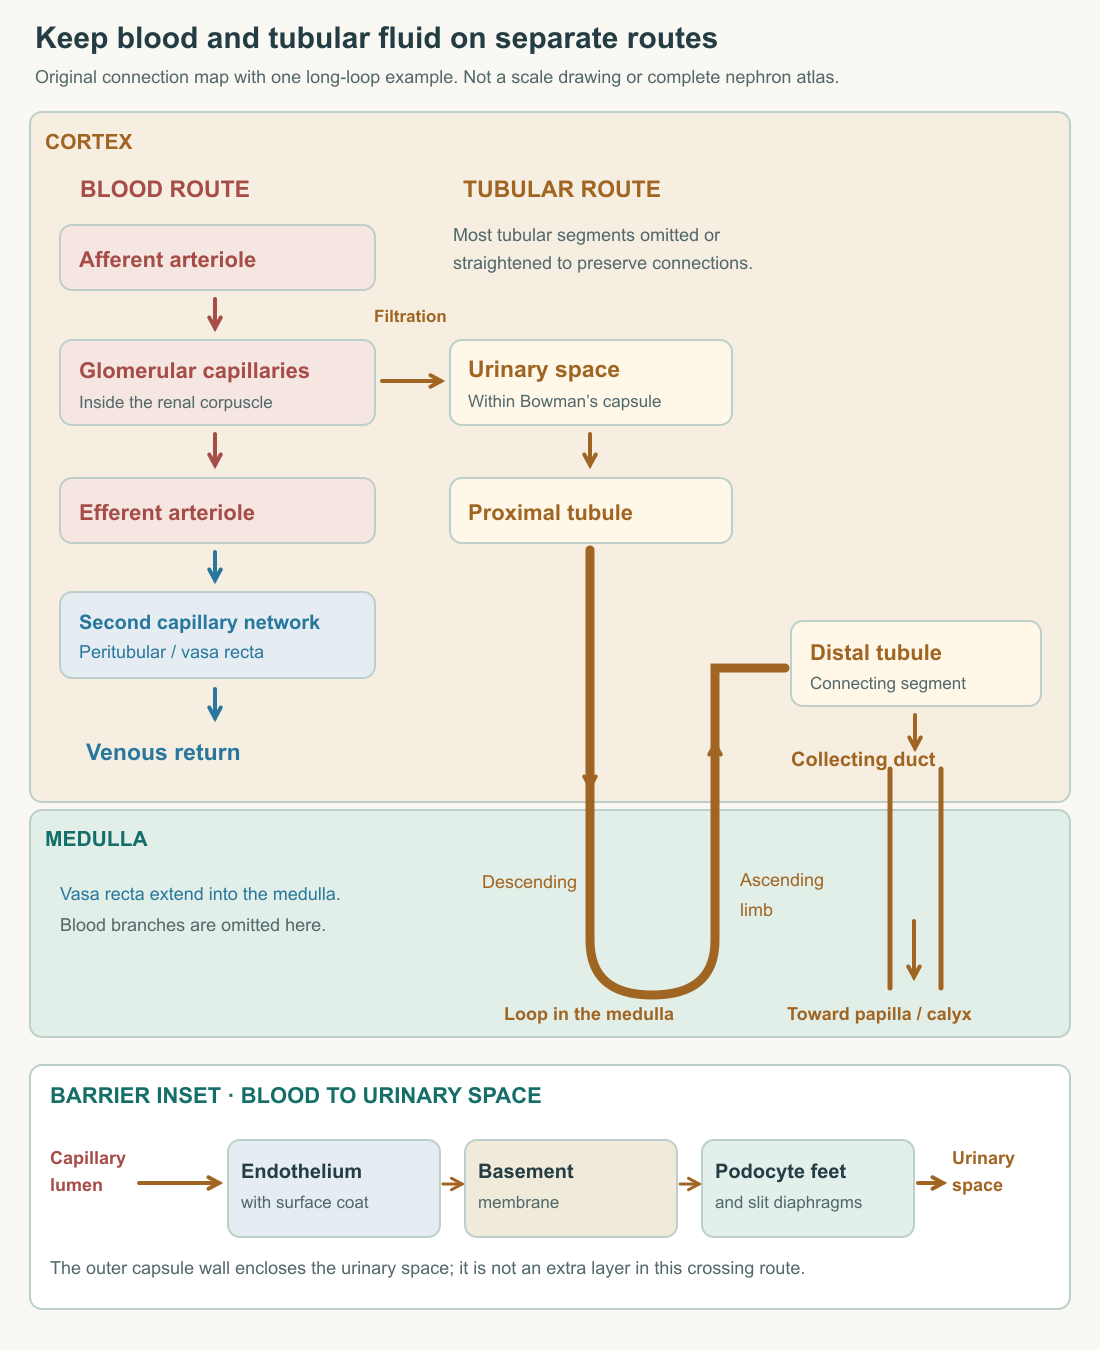
Follow the arrow into the urinary space on the map, then pause there. That arrow is filtration. The entire gold route that follows is not one extended filter performing an identical operation. Its segments give the initial fluid a changing composition before the final outflow.
Pressure supplies a driving force
A simplified filtration model balances hydrostatic and oncotic pressures across the barrier. Hydrostatic pressure is the mechanical pressure of fluid. Oncotic pressure describes the osmotic contribution of relatively retained proteins. Capillary hydrostatic pressure favors movement toward the urinary space; pressure in that space opposes it. The protein concentration difference ordinarily also opposes outward filtration. StatPearls: forces governing GFR.
To reason through the signs, imagine pushing water through a permeable wall from a left chamber to a right chamber. Raising left-side mechanical pressure favors left-to-right movement. Raising right-side pressure resists it. A pressure value without its location cannot tell you which effect to expect.
Now add proteins that remain predominantly on the left. Their osmotic effect resists net water movement toward the relatively protein-poor right side. This does not mean individual water molecules stop crossing in the opposite direction. We are describing the net movement resulting from competing influences.
For an original numerical model, use arbitrary pressure units. Let capillary hydrostatic pressure be 50, urinary-space hydrostatic pressure be 15, and the opposing oncotic difference be 25. The simplified net driving pressure is 50 minus 15 minus 25, giving 10. These numbers illustrate subtraction; they are not a patient's measurements or a universal human reference set.
If urinary-space pressure rises to 20 while the other stipulated values remain fixed, the net becomes five. If instead capillary pressure rises to 55, with the original opposing values, the net becomes 15. The same increase of five pressure units produces opposite effects depending on which side changes.
That exercise exposes why “higher pressure means more filtration” is incomplete. Which pressure? Across which boundary? What else changes? A precise sentence can be longer than a slogan while saving considerable confusion.
The same driving force can produce different flow
The simplified relation between filtration rate and pressure also includes a filtration coefficient, conventionally written Kf. It incorporates the available filtration surface and its hydraulic permeability. A pressure balance alone therefore does not determine how much fluid crosses per unit time. StatPearls: filtration coefficient.
Return to the net pressure of 10 in our model. Assign Kf a value of two volume units per time unit per pressure unit. Multiplication gives a filtration rate of 20 volume units per time unit. If the coefficient falls to one while the pressure remains 10, filtration falls to 10. The arithmetic represents a less effective crossing surface under the same driving conditions.
Alternatively, hold the coefficient at two and reduce the net pressure to five. Filtration again becomes 10. The same final rate can arise from two different changes. Observing the rate alone does not distinguish reduced effective surface or permeability from a reduced driving pressure.
There is a further distinction between water permeability and selectivity for a particular solute. An interface could change its passage of a large molecule without a proportional change in bulk fluid flow. Conversely, a change in driving force could alter total filtrate formation while the barrier's selectivity remained similar. “Filter performance” needs a defined outcome.
Our calculation treats pressure and coefficient as fixed average values. Along a real capillary, conditions can vary; proteins become more concentrated as relatively protein-poor fluid leaves. The model is useful for identifying directions of influence, but it is not a detailed reconstruction of every position along a glomerular loop.
Flow through a vessel is not flow across its wall
The blood route has an entrance and an exit as well as a permeable interface. Changing resistance in an entering vessel can change delivery and downstream pressure. Changing resistance after a capillary tuft can alter pressure within the tuft while also changing the amount of blood passing through it. The consequences of a vascular change therefore cannot be inferred from the word “constriction” alone.
In a simple water network with a pump, an upstream narrowing can reduce pressure reaching a downstream chamber. A narrowing after that chamber can raise pressure inside it while reducing through-flow. This is a physical analogy, not a complete model of renal vascular regulation. It helps separate pressure within a chamber from flow through the whole circuit.
The kidney also adjusts vascular behavior. Local myogenic responses and tubuloglomerular feedback help stabilize filtration over a range of conditions. That regulation has limits; it does not guarantee an identical rate regardless of systemic circumstances. StatPearls: renal autoregulation.
For now, this is enough detail to prevent a faulty inference. A supplied statement that arterial pressure changed does not, by itself, specify the final change in filtration. We need to know the local pressures, vascular responses and state of the filtration surface. Chapter 4 will reconnect local transport with feedback more explicitly.
How much of a substance enters the tubule?
For a freely filtered, unbound model solute, the amount entering filtrate per unit time equals its plasma concentration multiplied by filtration rate. This is its filtered load. The units make the relation intelligible: mass per volume multiplied by volume per time gives mass per time.
Suppose model solute A has a concentration of three mass units per volume unit and filtration is eight volume units per time unit. Its filtered load is 24 mass units per time unit. If concentration doubles while filtration is unchanged, the filtered load becomes 48. If filtration halves while concentration is unchanged, it becomes 12.
Neither result tells us the final excretion rate. We have calculated entry into a tubular route. An additional rule specifying reabsorption, secretion or other handling would be needed to calculate the exit. This boundary is worth keeping explicit even when the arithmetic feels easy.
Now introduce model solute B, which is not freely filtered. Stipulate that its concentration in initial filtrate is only one quarter of its total plasma concentration. With a plasma concentration of four and filtration rate of eight, its filtered load is eight, not 32: one quarter times four times eight. The quarter is a supplied property of this model, not a universal coefficient for real proteins or drugs.
This second example shows what the word “freely” was doing in the first. An equation can be correct under its assumptions and misleading when those assumptions are silently removed. Before multiplying a measured total plasma concentration by GFR, one must know whether that concentration actually represents material available to cross in the assumed way.
A fraction needs the correct denominator
Filtration fraction compares glomerular filtration rate with renal plasma flow. It asks what fraction of incoming plasma volume becomes filtrate. It does not compare filtration with whole blood flow, which includes cell volume. StatPearls: filtration fraction.
In an invented model, renal blood flow is 100 volume units per time, of which 60 are plasma. Filtration is 12. The filtration fraction is 12 divided by 60, or 20 percent. Dividing by 100 would give 12 percent, answering a different question because the denominator includes cells.
Now consider another model with plasma flow of 40 and filtration of eight. Its filtration fraction is also 20 percent even though both rates are lower. A fraction can remain unchanged when numerator and denominator change together. Reporting the fraction alone would conceal the difference in total fluid transfer.
The reverse is possible too. Two systems can have the same filtration rate while differing in plasma flow and therefore filtration fraction. This is why a complete physiological comparison often needs both absolute rates and their relationship. A percentage is not a substitute for the quantities from which it was calculated.
Measurement answers a narrower question than the whole organ
In ordinary clinical work, GFR is commonly estimated from blood markers rather than observed by collecting all initial filtrate. Creatinine and cystatin C have influences beyond filtration; creatinine-based estimates are less dependable in some circumstances, including unstable function and unusual muscle mass. Combining markers can address some limitations, but an estimate still requires interpretation in context. NIDDK: clinical measurements and eGFR accuracy.
The general reasoning is familiar from our flow models. A measured concentration is influenced by both entry and removal. If a hypothetical marker is produced at twice the rate while removal properties stay unchanged, its concentration can rise. A higher concentration therefore does not logically prove that removal alone changed.
Time matters as well. Following a sudden change, the amount accumulated in a compartment takes time to approach a new balance. A snapshot during that transition need not behave like a stable system. This is one reason to distinguish a model's steady-state assumption from a changing real situation.
A calibration exercise makes the issue concrete. Imagine a model marker whose stable concentration equals its production rate divided by a removal coefficient. Production is 12 mass units per time unit and the coefficient is four volume units per time unit, giving a concentration of three. A second system has production of six and a removal coefficient of two. Its concentration is also three. The observed concentrations match, while the underlying rates do not.
An estimator trained on systems with similar production may still be useful. Its uncertainty grows when applied to systems whose production differs from that assumption. This does not make estimation worthless; it explains why knowledge of the population and measurement conditions matters. Our two systems are invented algebraic cases, not a formula for interpreting personal creatinine results.
A good report therefore separates the observation, the inference and its conditions. “The marker concentration is three” is an observation in this example. “The removal coefficient is four” is an inference requiring the production assumption. Stating both makes disagreement testable: another investigator can ask whether production was established or merely presumed.
Even an accurately measured filtration rate concerns one important function. It does not directly measure every tubular transport process, every hormonal output or the condition of every microscopic structure. A useful measure becomes less useful when asked to stand for the entire organ without qualification.
At the end of this chapter, glucose entering filtrate should no longer seem paradoxical. The barrier permits an initial transfer; pressures and surface properties help set its rate; plasma concentration helps set a solute's filtered load. The next chapter follows that load through the tubule, where selective return and addition determine how entry becomes excretion.
Application
Draw a filtration barrier with a capillary lumen on one side and urinary space on the other. Add hydrostatic arrows from both sides and an opposing protein-related osmotic influence. Keep blood flow along the capillary distinct from fluid crossing its wall.
Check your understanding: A stipulated freely filtered solute has plasma concentration five mass units per volume unit and GFR six volume units per time unit. What is its filtered load? If urinary-space pressure rises while all other model factors stay fixed, which direction does filtration change? Can the original filtered load determine final excretion by itself?
Expected answer: The filtered load is 30 mass units per time unit. Higher urinary-space pressure opposes filtration, so filtration falls under the stated fixed conditions. Filtered load alone cannot determine final excretion because later tubular reabsorption, secretion or other handling may alter the amount remaining.
Compare two invented systems. System A has renal plasma flow 50 and GFR 10; system B has renal plasma flow 80 and GFR 10. Their filtration fractions are 20 percent and 12.5 percent. Explain why identical filtration rates do not imply identical through-flow, then state one additional property you would need to predict excretion of a named model solute.