Taking back and adding selectively
Two model kidneys receive the same blood flow and form the same amount of filtrate. Yet one excretes much more of a particular solute. The difference need not lie at the glomerulus. A tubular wall can return material to blood or add material to the lumen after filtration has occurred.
This chapter follows those crossings. We begin with the direction of movement, examine how an epithelial cell can support transport across two different surfaces, and then account for a substance from its entry into filtrate to its exit in urine. The bookkeeping will help us distinguish a real mechanism from a change that merely looks similar in the final sample.
Give each crossing a direction
Reabsorption moves material from tubular fluid toward blood; secretion moves it toward the lumen. Epithelial transport and nearby circulation support these exchanges, which differ among segments. OpenStax: tubular recovery and secretion.
These names are defined relative to a route. “Secretion” here does not mean a gland releasing a hormone into blood. The same ordinary word has a specific renal meaning: addition to tubular fluid from the blood side. To avoid ambiguity, write the starting compartment and destination beside the arrow.
Reabsorption does not mean urine flows backward toward the capsule. Fluid can continue forward along the lumen while some of its constituents cross sideways through the wall. Imagine a passenger leaving a moving train at a station: the passenger's route changes without the whole train reversing. The analogy identifies a branching journey, not the cellular mechanism of transport.
The reverse crossing adds to a moving stream. A secreted solute can enter downstream even if it did not cross the glomerular barrier at the beginning. That is why describing urinary excretion as “everything that got through the filter” leaves out a major part of renal handling.
An epithelial cell has two different working faces
An epithelial cell’s apical surface faces the lumen; its basolateral surface faces tissue and neighboring cells. Basolateral sodium–potassium ATPase uses ATP to export sodium and import potassium, maintaining gradients for other transport steps. OpenStax: epithelial transport mechanisms.
Draw a cell as a rectangle between lumen and tissue fluid. Put one doorway in the left face and a different doorway in the right. A capillary is another structure beyond that epithelial layer. The surrounding tissue fluid belongs on the map between tubular transport and return to blood; the basolateral membrane is not simply a hole opening into a vein. Getting a solute into the cell is only the first part of crossing the epithelium. To produce net reabsorption, it must also leave on the appropriate side and reach the circulation.
Suppose an invented cell admits substance A at six units per minute and releases it toward tissue fluid at six. Its internal amount can remain stable while it transfers six units each minute. Now suppose admission stays at six but exit falls to two. Initially, four units per minute accumulate inside. The cell is no longer in the same steady condition even though the first doorway is unchanged.
This example explains why transport across an organ cannot be inferred from one membrane protein alone. Entry, exit, gradients and the surrounding circulation form a connected process. If one step becomes limiting, upstream amounts can change and alter other steps.
Paracellular transport passes between epithelial cells; transcellular transport passes through them. Neither route is an unrestricted gap. OpenStax: tubular transport pathways.
Glucose shows how one gradient can support another movement
In the proximal tubule, sodium–glucose cotransporters SGLT2 and SGLT1 mediate glucose entry from tubular fluid at the apical membrane. Basolateral glucose transport permits movement toward the tissue fluid and circulation. The two cotransporters are distributed differently along the proximal route, with SGLT2 prominent earlier and SGLT1 contributing farther along. Vallon: renal glucose transport.
Sodium moving down its electrochemical gradient can support glucose entry against its concentration gradient. The ATP-consuming pump maintains the sodium conditions. This is secondary active transport: energy use supports the linked system although the glucose cotransporter does not directly split ATP. OpenStax: sodium-coupled glucose recovery.
There are two common errors to avoid. First, the sodium gradient is not an inexhaustible source of free energy. Maintaining it requires work. Second, a transporter does not simply “recognize useful things” and move them regardless of circumstances. Its behavior depends on molecular interactions and the gradients on which the transport cycle relies.
A useful causal chain is therefore: energy use maintains a gradient; coupled entry uses that gradient; an exit pathway completes transfer across the cell. Remove one link in a stipulated model and ask which quantities initially change. The resulting account is more informative than saying that the kidney “takes glucose back.”
Transport is also finite. Glucose reabsorption has a capacity, and different nephrons need not reach that capacity at the same point. A sharp corner on a simple graph is an approximation of a more distributed biological response. Vallon: saturation of renal glucose transport.
A transport limit produces a testable prediction
Construct a deliberately simple model with a filtered load that can vary and a maximum recovery capacity of 30 mass units per time unit. Assume no secretion, synthesis, breakdown or accumulation. If filtered load is 20, recover all 20 and excrete zero. If filtered load rises to 40, recover 30 and excrete 10. At a load of 60, recovery remains 30 and excretion rises to 30.
Draw filtered load on the horizontal axis and reabsorption on the vertical axis. The recovery line rises with load until it reaches 30, then becomes horizontal. A second line for excretion stays at zero initially and rises after the capacity is exceeded. These are rules of our model, not diagnostic thresholds for humans.
Now lower maximum recovery capacity to 15 without changing the filtered load of 20. Excretion becomes five. The same observation—material appearing in the final urine—can arise either because delivery exceeded an unchanged capacity or because capacity fell at an unchanged delivery.
The distinction is experimentally useful. To separate those explanations, one would need evidence about the incoming load and the transport system, rather than only the final sample. Our earlier equation for filtered load supplies part of that evidence: concentration and filtration rate jointly determine entry for a freely filtered solute.
This is also a reason to resist interpreting every example of urinary glucose as evidence of the same underlying event. The renal route contains more than one place where the relationship between delivery and recovery can change.
A human genetic study tests the transport account
Lee and colleagues reported a 2012 multicenter study of 23 unrelated Korean children with familial renal glucosuria, characterized by persistent glucose excretion without hyperglycemia. They analyzed SLC5A2, the gene encoding SGLT2, and found at least one variant described as a mutation in each participant. Children with two mutations generally had greater urinary glucose excretion than those with one. The abstract supplies these findings; it does not provide a complete appraisal of each variant's function. Lee and colleagues: study abstract.
The observation fits the distinction between delivery and recovery: altered tubular transport can permit glucose loss without requiring high blood glucose. It supports the importance of the transporter in humans. It does not establish that every future person with glucose in urine has this inherited condition, nor estimate its frequency in the general population. The cohort was selected for the condition rather than sampled to measure population prevalence.
Notice the improvement over a purely verbal explanation. The transport model identifies a component; a genetic study relates differences in that component to a relevant human phenotype. The evidence is specific enough to test the mechanism while remaining narrower than a universal diagnostic claim.
Secretion provides another route into tubular fluid
Organic anion transport in proximal tubules illustrates secretion. Transporters can take solutes from the blood side into epithelial cells, followed by exit across the apical membrane into the lumen. Different proteins participate in the two steps. Organic anion transport systems handle a range of endogenous compounds and some drugs. Otani and colleagues: organic anion transport review abstract.
The word “organic” here concerns carbon-containing compounds, and “anion” means a negatively charged ion. Neither word means harmless, natural, toxic or waste in every circumstance. Physiological categories identify chemical and transport properties, not moral judgments about a substance.
For a model secreted solute, label an arrow from surrounding blood through an epithelial cell into tubular fluid. This arrow can add material after glomerular filtration. If you omit it from the account, you may calculate an excretion rate that is too low even with a correct filtered load.
A shared transport step can also become limiting in a model with multiple substrates. Suppose a transport system can move ten total units per interval and A occupies seven of those units. Only three remain for B under the stipulated rules. This illustration shows why identifying a shared pathway can matter, but it is not a prediction of an interaction between particular medications. Actual transporters differ in affinity, regulation and available capacity.
Close the material balance
For a solute that is not synthesized, consumed or stored within our model route, final excretion equals filtration minus reabsorption plus secretion. Every term must refer to the same substance, time interval and amount units. A concentration cannot be inserted where the equation requires an amount per time.
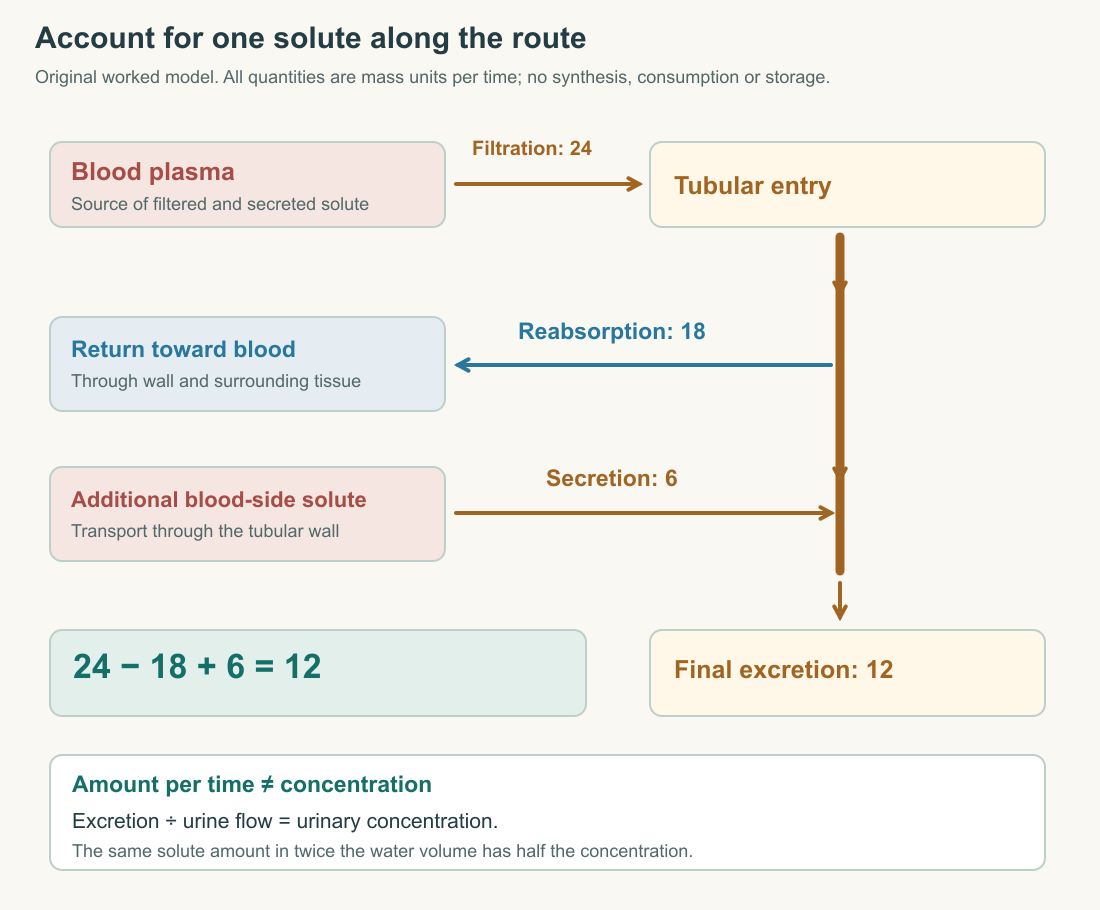
Take a model with a filtered load of 24 mass units per time, reabsorption of 18 and secretion of six. Final excretion is 12. A second model filters the same 24, reabsorbs 12 and secretes nothing. It also excretes 12. The final excretion rates match, but the internal transfers differ.
This is a recurring limit of endpoint measurements. They can establish the combined result without uniquely identifying every contributing step. To separate reabsorption from secretion, more localized measurements or additional assumptions are required.
There is another useful inference. If excretion exceeds the filtered load, our simple model requires net addition along the route. If excretion is below filtered load, it requires net removal. But “net” is essential. An excretion rate below filtration does not prove secretion was zero; reabsorption may simply have been greater.
Suppose filtration is 20 and excretion is 14. One compatible account is reabsorption of six with no secretion. Another is reabsorption of 11 and secretion of five. Both give the same net removal of six. State the net result unless the individual processes have actually been resolved.
An even sharper comparison starts with filtration and excretion both equal to 20. One possible model has no later crossings. Another reabsorbs eight and secretes eight. Their net changes are both zero, but the second has substantial transport in each direction. A balanced account does not imply an inactive wall.
To distinguish them, imagine a tracer that marks material entering at a particular point, together with measurements that resolve its later location. Such a design would ask about the route taken, rather than only comparing totals. Whether a real tracer is suitable depends on whether its behavior matches the substance and whether the sampling method changes the system. The thought experiment identifies the missing information without pretending that an endpoint result contains it.
This is a general experimental lesson from the kidney: equal input and output can conceal internal circulation, exchange and work. Before concluding that a process is absent, consider whether opposing contributions might cancel in the measured total.
Water can change the sample without changing the solute amount
Imagine 12 mass units of solute in six volume units of tubular fluid. Concentration is two. If three volume units of water leave while all 12 mass units remain, concentration becomes four. Nothing was added to the solute account; its concentration doubled because its container became smaller.
Now let half the solute and half the water leave together. Six mass units remain in three volume units, so concentration stays at two even though the amount traveling onward has halved. An unchanged concentration does not mean no transport occurred.
These examples are especially important when examining fluid sampled at different points along a route. Concentration measurements must be paired with flow or a suitable reference if the question concerns how much material remains. Otherwise water movement can disguise or imitate changes in solute handling.
In a timed final collection, multiplying urinary concentration by urinary volume per time gives excretion rate. A spot concentration alone lacks that volume-per-time term. This is an accounting distinction, not an invitation to interpret a personal sample without its clinical context.
A real segment can also make or use a substance
Our three-process equation was deliberately restricted. Kidney cells are metabolically active. The proximal tubule, for example, can generate glucose through gluconeogenesis, while renal tissues also consume substrates. A complete organ balance must include production, consumption and changes in storage when they matter. Vallon: renal glucose formation and use.
For an original general balance, write incoming amount plus production minus outgoing amount minus consumption equals change in stored amount. The incoming and outgoing terms must include every route crossing the boundary you chose. A whole-kidney boundary has different entries and exits from a boundary drawn around one tubular segment.
This does not make the simpler renal equation wrong. It makes its domain explicit. For a stipulated inert model solute under steady conditions, filtration, reabsorption and secretion can be enough. For a metabolized compound in a changing system, the extra terms may be essential.
The skill is to choose a model that preserves the process being investigated. A simple model is valuable when it makes assumptions visible and yields a testable prediction. It becomes misleading when omitted processes are silently treated as nonexistent.
We can now follow a substance beyond the initial filter. Its amount changes through named crossings; its concentration also depends on water; its final excretion combines several processes. The next chapter asks how the kidney adjusts those processes when the body's water and salt conditions change.
Application
Draw one epithelial cell between tubular lumen and tissue fluid. Label apical and basolateral surfaces. Add a reabsorption route crossing both surfaces and a separate secretion route in the opposite direction. Explain why entry into a cell alone does not prove complete transfer to the other compartment.
Check your understanding: A model solute is filtered at 30 mass units per time, reabsorbed at 22 and secreted at four. There is no production, consumption or storage. Calculate excretion. If the urinary flow doubles while excretion stays fixed, what happens to urinary concentration?
Expected answer: Excretion is 30 minus 22 plus four, or 12 mass units per time. Doubling urinary flow while excretion remains 12 halves concentration. The concentration change does not show a change in total solute excretion.
Explain two different ways our capacity model could produce urinary solute loss: increased filtered load at unchanged capacity, and reduced capacity at unchanged load. Use the human genetic study to show why the distinction matters, while stating why its selected cohort cannot diagnose an unrelated person's result or establish population prevalence.