After eating and between meals
Dinner ends, but the work of the body continues. The brain, heart and other tissues do not shut down until breakfast, and blood cannot carry an entire night's supply of every fuel as one enormous dissolved stock. The liver helps bridge the changing interval between incoming nutrients and ongoing demand. To understand that contribution, follow materials through storage, release and chemical conversion. Calling all three “making energy” conceals the central problem: which tissue needs which molecule, at what time, and by what route can it obtain it?
A changing balance, not an on–off switch
The absorptive state is the period in which substantial nutrients from a meal are being absorbed. The postabsorptive state follows as that incoming contribution diminishes. These are useful physiological descriptions, not two settings that switch at an identical minute after every meal. Meal composition, intestinal processing, existing stores, activity and hormonal signals affect the transition.
The OpenStax metabolic-state overview provides the broad contrast between storing incoming nutrients and drawing on internal sources. Our working model treats it as a shift in relative rates. Synthesis and breakdown need not each become absolutely zero when the other predominates. A net increase in a store can coexist with some ongoing removal from it.
Use an original bookkeeping example. During one interval, 12 glucose-equivalent units enter a glycogen store and 4 leave. The store gains 8. During a later interval, 3 enter and 9 leave, so it loses 6. A measurement made only at the beginning and end reveals the net change, not both underlying rates. Saying that a store “gained eight” does not prove that exactly eight units entered it.
The same caution applies to the blood. A steady glucose concentration does not mean tissues have stopped taking glucose up. It can reflect a continuing balance between appearance and removal. A river can maintain its level while water passes through it; similarly, a regulated concentration can conceal substantial material turnover. The liver is one contributor to that balance, together with intestine, muscle, adipose tissue, kidneys and other organs.
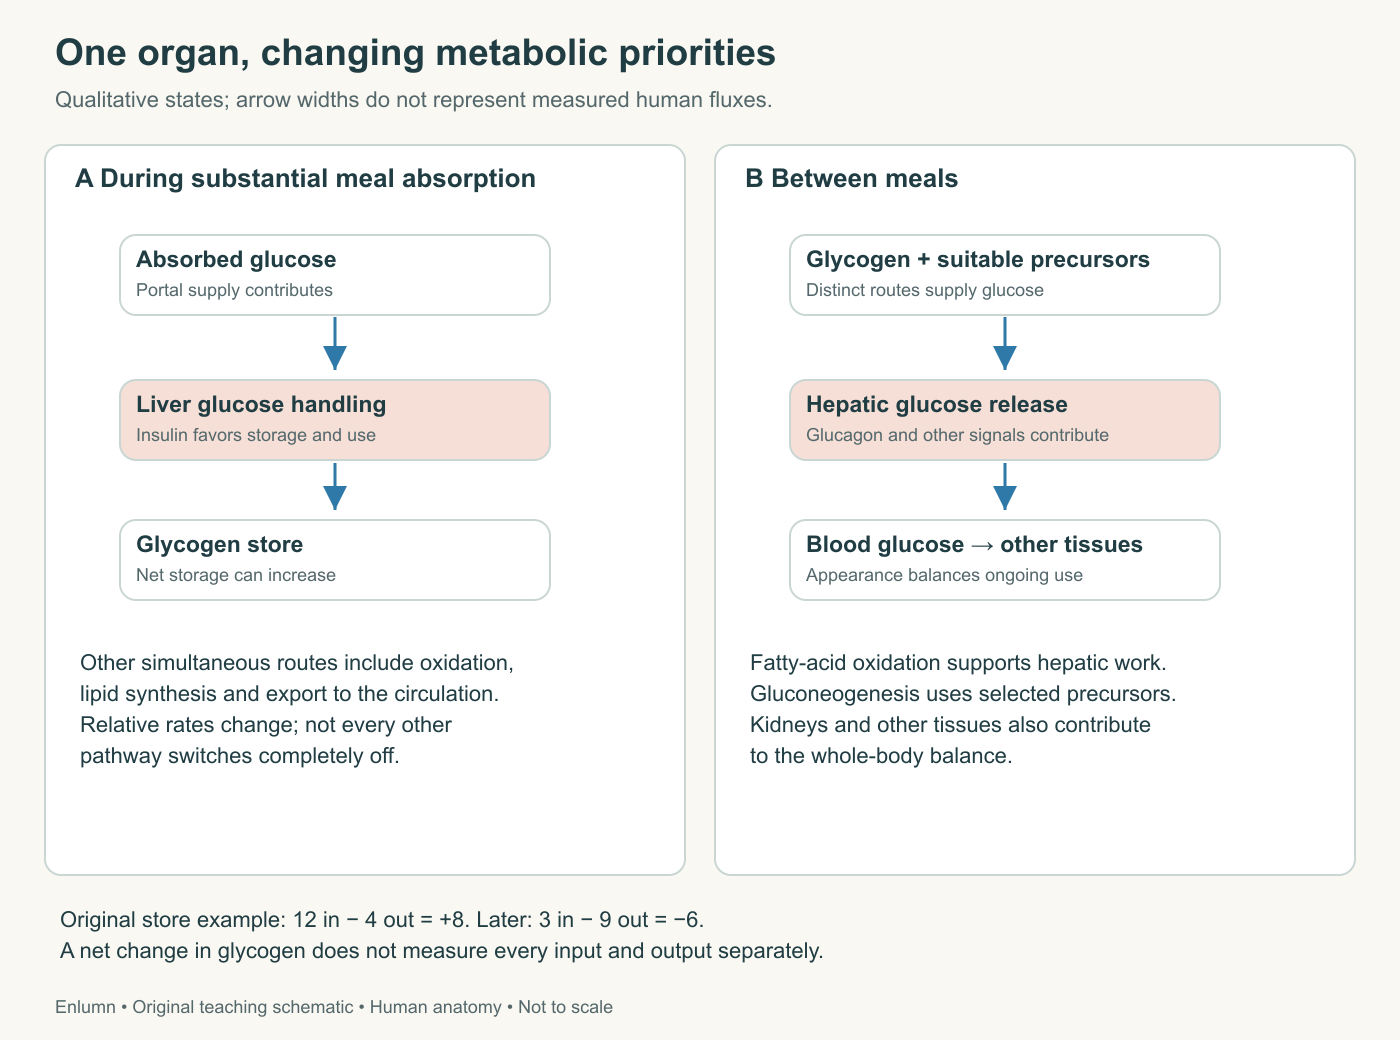
These panels compare relative priorities, not mutually exclusive modes. Glucose handling includes simultaneous pathways, and the whole-body balance also depends on other organs. The invented store example distinguishes net accumulation from the separate rates entering and leaving a pool.
Why store glucose as glycogen?
Glycogen is a branched polymer built from glucose residues. Linking many residues into larger molecules allows a substantial carbohydrate reserve without keeping all of it as separate freely dissolved glucose molecules. The branches also provide many sites at which enzymatic processing can occur. This is a chemically organized store, not a pile of unchanged sugar crystals inside a cell.
Glycogenesis means glycogen synthesis; glycogenolysis means its breakdown. The terms look similar because they refer to opposite changes involving the same material. Neither is the same as glycolysis, the pathway that converts glucose toward pyruvate while supporting cellular energy metabolism. A reader who confuses the words can mistakenly send stored glycogen directly out of the liver as if it were the usual circulating fuel.
Liver glycogen can support blood glucose because hepatocytes have the machinery to produce free glucose from glucose-6-phosphate and release it. Skeletal muscle lacks the corresponding capacity for substantial direct glucose export from its glycogen store. Its store mainly supports its own work. The glycogen reference makes this tissue distinction explicit. Having the same stored polymer does not give two organs the same physiological role.
That does not make muscle metabolically isolated. It exchanges other materials with the circulation, including substrates that the liver can use. The distinction concerns a particular route: direct release of free glucose from glycogen. If we broaden that into “muscle cannot help the rest of the body,” we replace a useful biochemical difference with a false generalization.
Imagine two storerooms containing equal numbers of boxes. One has an exit that accepts the boxes after repackaging; the other can open them only for use inside. The inventory alone does not determine what can be supplied elsewhere. In the body, enzymes and membrane transport determine those possibilities. This is why a whole-body total of stored carbohydrate cannot by itself tell us how much glucose can enter blood over the next hour.
Hormones change how pathways operate
Insulin and glucagon are pancreatic hormones with important effects on hepatic metabolism. In a broad meal-response model, increased insulin signaling favors glycogen storage and suppresses hepatic glucose production. As absorbed nutrient supply diminishes, changes in insulin and glucagon signaling favor greater release of glucose from internal sources. These are signals acting on biochemical machinery, not packets of fuel delivered to the liver.
The signal must be received and translated into changes in enzyme activity and, over longer periods, gene expression. Substrate availability also matters. A strong signal to mobilize glycogen cannot release an unlimited amount from an almost depleted store. Conversely, ample substrate does not force every possible pathway to operate at its maximum rate. Regulation connects information, available materials and cellular capacity.
Avoid imagining insulin as a universal key that opens every glucose entry door in the same way. Its effect on glucose transport in skeletal muscle and adipose tissue differs from its regulation of glucose handling in hepatocytes. The liver can exchange glucose through routes that are not the same insulin-dependent transporter-recruitment system used in those tissues. Insulin still strongly influences what hepatocytes do with glucose and how much glucose they produce.
Nor does a hormone act on only one organ. The liver's response occurs alongside changes in muscle and adipose tissue, and hormones such as epinephrine contribute under other circumstances. This course follows the hepatic part of the network; the pancreas course develops the signaling loop. Keeping those subjects connected prevents us from attributing a whole-body blood concentration to one organ working alone.
Making glucose is different from releasing a store
Gluconeogenesis produces glucose from selected noncarbohydrate precursors. Important inputs include lactate, glycerol and carbon skeletons from certain amino acids. The process consumes energy and uses a sequence of reactions that is not simply every step of glycolysis run backward. It allows the liver to supply glucose even as its glycogen reserve declines.
The difference is material, not just verbal. Glycogenolysis draws glucose residues from an existing carbohydrate store. Gluconeogenesis assembles glucose through another route using suitable precursor molecules. A diagram that puts both under one arrow marked “stored sugar released” obscures where the carbon comes from and what resources the process requires.
Take lactate as a concrete example. Some tissues release lactate into circulation. The liver can take it up and use its three-carbon skeleton in glucose production. Two three-carbon inputs can contribute the carbon for a six-carbon glucose molecule. That carbon accounting does not mean the conversion is spontaneous or free. Enzymatic steps, energy and appropriate cellular conditions are necessary.
The resulting exchange is often represented as part of the Cori cycle. A peripheral tissue can obtain ATP through glycolysis while releasing lactate; hepatic processing can return carbon to glucose at an energy cost to the liver. The whole cycle is not an energy machine that creates extra ATP from nothing. It distributes tasks and costs between organs. Following the carbon and following the energy are related exercises, but their arrows are not identical.
Glycerol provides another useful distinction. A triglyceride has a glycerol backbone and fatty-acid chains. The glycerol can contribute to gluconeogenesis. Most even-chain fatty-acid carbon does not provide net glucose in the same way in humans; its oxidation can instead help supply energy for hepatic work. “Fat becomes sugar” is therefore too broad to describe the route. Which component of the fat molecule is being followed matters.
The kidneys also contribute to gluconeogenesis, with their contribution depending on physiological state. The liver is central to this course because of its large role and connections, not because it monopolizes every route of glucose production. A whole-body measurement of glucose appearance cannot automatically be labeled a liver-only measurement.
Handling fats includes making, using and exporting
The liver receives fatty acids from the circulation, handles remnants of circulating lipoprotein particles, synthesizes lipids and exports some of them. It can also oxidize fatty acids to support its own energy needs. These processes occur in different proportions across states. A triglyceride droplet is a store; a lipoprotein particle is a transport arrangement; a fatty acid entering an oxidative pathway is a substrate for chemical work.
Lipoproteins package lipids with proteins and other components for transport in aqueous blood. Hepatic very-low-density lipoprotein, or VLDL, is one route for exporting triglycerides. It differs from an intestinal chylomicron even though both carry lipid. The liver's export and the intestine's initial handling belong to connected but distinct stages.
The Endotext account of hepatic lipid handling identifies several routes that can contribute to excess lipid accumulation: greater incoming delivery, greater synthesis, less oxidation and impaired export. This is a useful mechanistic frame. A large store does not identify which of those rates changed, and a low concentration in the outgoing blood does not necessarily mean there is little lipid inside the organ.
For an invented steady-state ledger, let 7 lipid units arrive and 3 be synthesized during an interval. If 6 are oxidized and 4 exported, the store does not change. If export falls to 2 with everything else fixed, the store gains 2 per interval. The same gain would result if export stayed at 4 but incoming delivery rose to 9. Identical accumulation can arise from different causes, so measuring the store alone cannot choose between them.
In some states, the liver also produces ketone bodies from fatty-acid-derived material and exports them as fuels usable by other tissues. Their production is a normal physiological capability; the term does not itself mean a person has a dangerous acid–base disturbance. Understanding that capability does not require undertaking a fast or assigning a dietary program. Here it illustrates the liver's ability to change the form in which fuel is distributed.
Amino acids carry both carbon and nitrogen
Amino acids can be used to synthesize proteins and other needed molecules. When they are broken down, their carbon skeletons and nitrogen groups require different handling. Some carbon skeletons contribute to glucose production or oxidation. Nitrogen cannot simply be converted into carbon dioxide alongside the carbon; its chemistry requires other routes.
The liver converts much waste nitrogen into urea, which is released into blood and ultimately handled by the kidneys. The IQWiG physiological overview connects these two organs. Urea synthesis and urinary excretion are different steps. A liver does not make urine, and a kidney cannot compensate for every missing hepatic transformation merely by filtering more blood.
This helps explain why “protein gives energy” is an incomplete metabolic account. Carbon may contribute to energy metabolism, while nitrogen must be transferred and disposed of appropriately. It also explains why amino-acid supply is not simply a disposable surplus: those molecules support tissue maintenance and synthesis. The liver coordinates several demands, rather than selecting one universal fate for every amino acid after a meal.
Test the model with measurements
Suppose a fictional experiment measures a liver glycogen store at 100 units, then 70 units after three hours. Net loss is 30 units, averaging 10 per hour. A separate whole-body tracer measurement estimates glucose appearance at 16 units per hour. Subtracting gives 6 units per hour not accounted for by the measured net glycogen loss, but that subtraction alone does not prove that exactly 6 came from hepatic gluconeogenesis.
Why not? The two measurements must use compatible units and time intervals. The glycogen measurement is a net change and may conceal simultaneous synthesis and breakdown. Glucose can arise from sources outside the liver. Some glycogen-derived material may be used locally rather than exported as free glucose. An informative experiment addresses such assumptions instead of letting arithmetic silently solve them.
This is the broader lesson of the meal cycle. Concentration, stored amount, gross flux and net balance are different quantities. A stable blood glucose concentration can coexist with declining liver glycogen and continuing gluconeogenesis. A growing hepatic lipid store can coexist with lipid export. The job of physiology is to connect these observations through mechanisms, not to turn one measurement into a verdict about the whole organ.
Check your understanding: Why can blood glucose remain fairly stable while the amount of glycogen in the liver falls?
Expected answer: Glucose continues to enter and leave blood. Hepatic glycogen breakdown and gluconeogenesis, together with other contributions, can balance tissue uptake as intestinal input diminishes. A stable concentration describes the balance of flows; it does not imply unchanged internal stores or zero glucose use.
Application
Allow 12–15 minutes. Make two connected diagrams, one during substantial meal absorption and one between meals. Label liver glycogen, blood glucose, suitable gluconeogenic precursors, adipose-derived fatty acids and hepatic lipid export. Use arrow thickness only to indicate relative emphasis, without claiming that thinner routes are absent.
Complete the original glycogen and lipid ledgers, keeping storage changes separate from gross inputs and outputs. Then explain why measuring a blood concentration, measuring a tissue store and measuring a rate answer three different questions. Do not use personal glucose readings or change your eating schedule for this exercise.