Crossing the epithelium
A glucose molecule released from the pasta reaches the brush border. It is small compared with starch and readily soluble in the surrounding fluid. Yet it does not simply dissolve through the cell's lipid membrane at whatever rate the body requires. The intestine must combine molecular selectivity with a source of directional driving force. The same surface also handles fructose, amino acids, ions and water by pathways that are not all identical.
Rather than memorize a transporter catalogue, follow three crossings: glucose entering an enterocyte, a short peptide entering by a different coupled mechanism, and material moving between neighboring cells. Each reveals a different part of the general problem. At every step, specify the two compartments, the molecule moving and the force or process that permits movement.
A cell has two different sides
An enterocyte's apical membrane faces the intestinal lumen. Its basolateral membrane faces neighboring cells and the tissue beneath the epithelium. Proteins are distributed differently across these surfaces. A transporter at the apical side may bring a substance into the cell while a different protein at the basolateral side permits its onward movement.
This organization is called polarity. It does not mean that one side is electrically positive and the other negative in the ordinary meaning of a battery label. It means the cell has distinct structural and functional domains. Electrical differences also matter for transport, but they are a separate property that must be identified explicitly.
Movement through the cell is transcellular transport. A molecule crosses the apical membrane, encounters the intracellular environment and crosses a basolateral membrane before entering tissue fluid. Reaching tissue fluid is still distinct from reaching capillary blood. The capillary has its own endothelial boundary. A simplified arrow can combine these steps only if its caption makes that simplification clear.
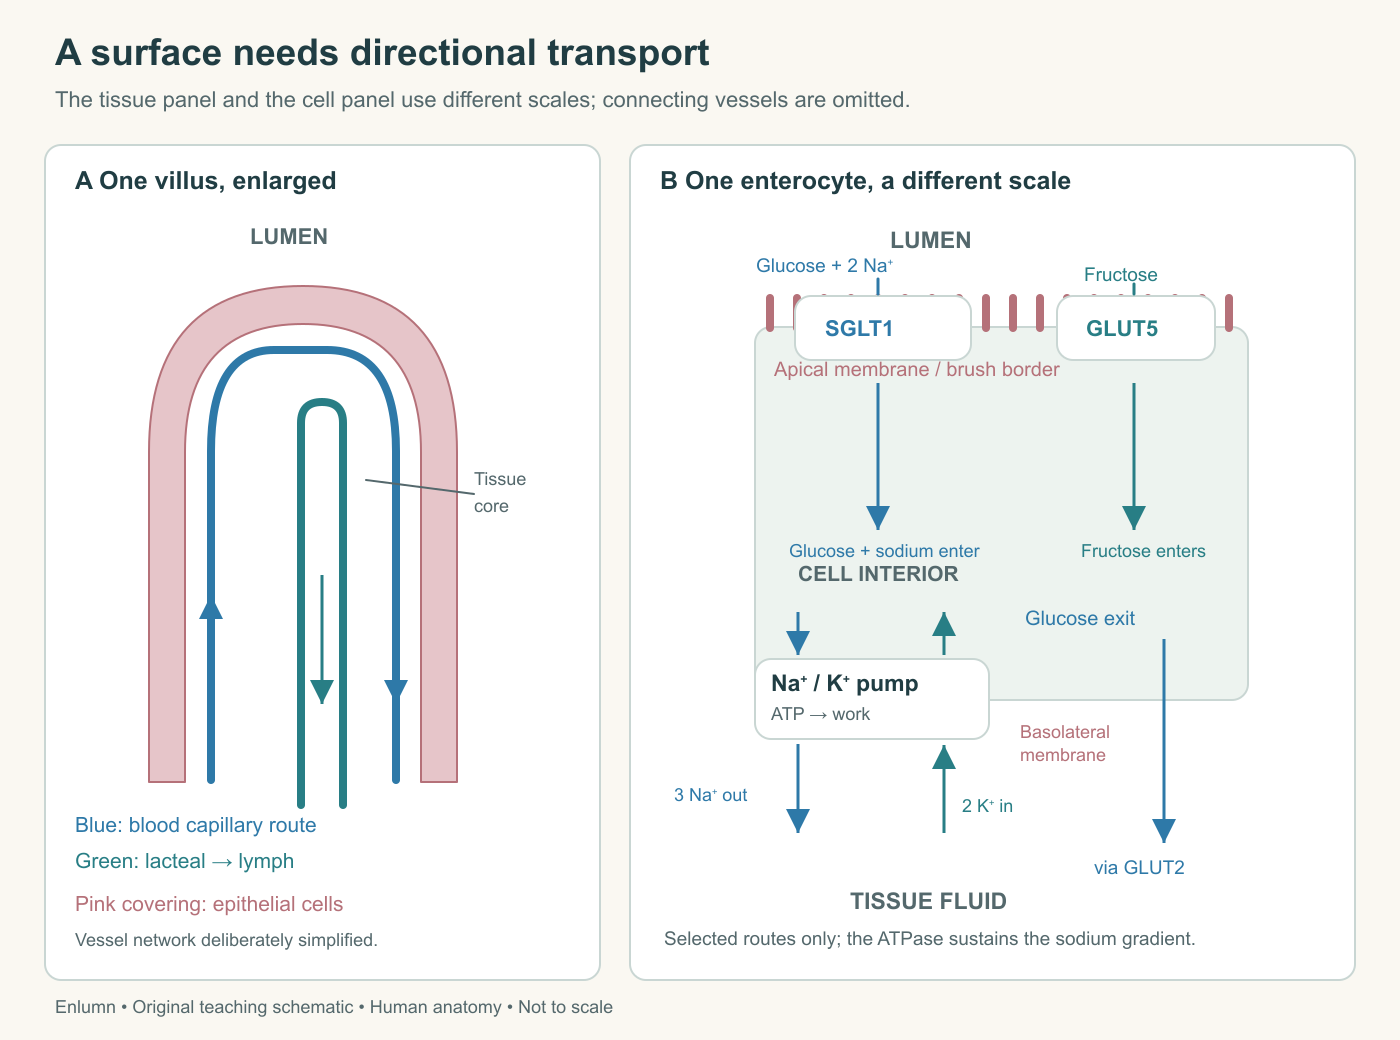
The left panel shows tissue organization; the right shows selected transport mechanisms at a different scale. The glucose cotransporter uses a sodium gradient supported by an ATP-consuming pump on the tissue-facing side. Not every intestinal transporter or route is shown.
Gradients can store an opportunity for movement
Diffusion reflects the movement of particles and the tendency for net movement down an appropriate gradient. A neutral solute's concentration difference is part of that description. For a charged ion, the electrical difference also matters. The combined chemical and electrical influences form an electrochemical gradient.
Imagine two compartments separated by a membrane that permits a neutral solute to cross. If the solute is more concentrated on one side, molecules still move in both directions, but initially more cross from the more concentrated side. Net movement can therefore occur without every molecule marching in a single direction. At equilibrium, microscopic movement continues even when the opposing fluxes balance.
A membrane protein can facilitate this movement without directly consuming ATP on each transport cycle. Facilitated diffusion is still constrained by the relevant gradient. Calling a process protein-mediated does not automatically make it active transport. Conversely, a process can depend on cellular energy even when the protein moving the nutrient is not the one that hydrolyzes ATP.
This distinction is crucial for intestinal glucose. The cell maintains low intracellular sodium relative to the surrounding fluids, with an electrical environment that also favors sodium entry under ordinary conditions. That gradient is an available source of energy for coupled transport. Maintaining it requires work elsewhere in the membrane.
Glucose can travel with sodium
SGLT1, the sodium–glucose cotransporter, provides a major apical route for glucose and galactose uptake. Sodium moving down its electrochemical gradient can drive sugar movement into the enterocyte, including under conditions where the sugar's concentration difference alone would not favor entry. This is secondary active transport: the nutrient movement uses a gradient created and maintained by another energy-consuming process.
At the basolateral membrane, the sodium–potassium ATPase uses ATP to move sodium out of the cell and potassium into it. In its usual transport cycle, three sodium ions leave and two potassium ions enter. This helps sustain the sodium gradient on which several apical transport pathways depend. The pump does not carry glucose, and SGLT1 does not itself become the sodium–potassium pump.
The standard SGLT1 coupling description is two sodium ions with one glucose molecule. In an original bookkeeping model, suppose 12 glucose molecules enter through this route. That brings 24 sodium ions inward. Removing those 24 through pump cycles carrying three sodium ions outward requires eight cycles, assuming this is the only sodium load and ignoring all other fluxes. The model isolates a relationship; it is not an estimate of the intestine's total energy cost.
Why the qualification? Real cells have additional sodium entries and exits, potassium recycling, electrical constraints, maintenance costs and many other processes consuming ATP. Eight modeled cycles account for the selected sodium load, not every expense incurred while absorbing 12 glucose molecules. A correct small calculation can become misleading if its boundary is silently expanded.
The glucose can subsequently leave through basolateral transport, with GLUT2 commonly used in the standard explanatory diagram. It is better to present this as a selected principal route than as proof that no alternative exit is possible in any physiological or disease condition. The Wright and colleagues review abstract highlights how human transport disorders complicate overly exclusive diagrams. The simple model explains coordination without exhausting the biology.
Fructose tests the rule
Fructose uses a different principal apical transporter, GLUT5, which supports facilitated diffusion. It does not enter by the same sodium-coupled SGLT1 mechanism used for glucose and galactose. These sugars may share parts of their later metabolic fate, but chemical similarity does not make their entry mechanisms interchangeable.
Suppose a fictional intervention selectively disables one apical transporter while leaving cell viability and other routes unchanged. If glucose and galactose uptake fall together while fructose uptake is preserved, that pattern supports a shared pathway for the first two. It does not establish that fructose can never be affected in a real disease, where several processes might change at once.
Human glucose–galactose malabsorption provides a real example of selective transport failure. Variants affecting SLC5A1, the gene encoding SGLT1, can severely impair intestinal uptake of glucose and galactose. The MedlinePlus Genetics account explains this link. The example shows why completing digestion does not guarantee uptake: a sugar can already be in its simple molecular form while the relevant transport machinery fails.
This is a rare inherited disorder, not a label to infer from ordinary symptoms after a meal. For our purpose, its value is mechanistic. A specific molecular impairment helps distinguish a transport step from a general inability to digest food. It also shows why “small molecules pass through” is an inadequate explanation of intestinal absorption.
Transport capacity can become limiting
A finite number of transport proteins can perform only so many cycles over a given interval under specified conditions. Increasing available substrate can initially increase transport, then produce a smaller additional effect as the pathway approaches its effective capacity. This is one reason doubling luminal concentration need not double uptake rate.
Use a deliberately simple fictional rule: uptake equals 100 times concentration divided by the sum of concentration and 5. With concentration 5, uptake is 50 units per minute. At concentration 10, it is about 66.7; at 20, it is 80. The maximum approached by the rule is 100. The constants are invented, and the equation is a teaching illustration of saturation, not a fitted human intestinal model.
Now distinguish concentration from delivery. Ten units per milliliter flowing past at two milliliters per minute provides 20 units per minute. Five units per milliliter at six milliliters per minute provides 30. A lower concentration can accompany a higher incoming amount per minute. Which is absorbed depends on contact, available transport, residence time and the distribution of concentrations near the membrane.
The intestine contains spatial gradients, multiple pathways and a moving mixture. Consequently, an isolated transporter equation does not predict absorption of an entire dinner. Its use is to sharpen a question: is a change in uptake consistent with altered substrate availability, altered capacity or some combination? A whole-organ measurement alone may not separate them.
Short peptides use a related principle
Dipeptides and tripeptides can enter through PepT1, a transporter coupled to hydrogen ions. The immediate driving gradient therefore differs from the sodium coupling just described. Maintaining the local ionic environment involves other transport systems, linking peptide uptake indirectly to cellular energy use. Secondary active transport is a family of coordinated mechanisms, not one protein repeated under different names.
Inside the enterocyte, peptidases can hydrolyze these short peptides into amino acids. The amino acids then leave through basolateral transport pathways. Free amino acids can also enter directly from the lumen using several apical systems. The intestine thus has parallel ways to recover dietary amino-acid residues, which helps explain why measuring one route cannot establish total protein-derived uptake.
Imagine that 15 free amino acids enter a fictional cell while five tripeptides enter alongside them. After complete intracellular hydrolysis of the tripeptides, the incoming material represents 30 amino-acid residues. Counting only the 20 transported molecules would understate the number of residues. Counting every residue as a separately transported molecule would misdescribe the membrane work.
The distinction between molecule count and component count becomes useful throughout physiology. A transport event can carry a package containing several components; later processing changes the package count. Write the units in the margin before calculating. “Molecules,” “residues,” “grams” and “transport cycles” cannot substitute for one another merely because all are numbers.
Between cells is a regulated route
Not all movement across an epithelium must pass through the cytoplasm of a cell. The paracellular route passes between adjacent cells, with tight junctions helping regulate permeability. A tight junction is not a permanently welded seam impermeable to every ion and water molecule. Its molecular organization contributes selectivity and varies by location and condition.
This distinction prevents two opposite errors. One is to deny all movement between cells because they form a barrier. The other is to treat any paracellular movement as evidence that the barrier is pathologically broken. A functioning epithelium combines controlled permeability with restriction of inappropriate entry. The useful question is permeability to what, through which route, under which conditions?
Water movement is strongly coupled to osmotic conditions created by solute handling. Water can cross both cellular and paracellular pathways. Net intestinal water absorption need not mean that every small region is absorbing water at every instant. Secretion and absorption coexist, and the measured result is their balance over the chosen place and interval.
For example, if a modeled segment absorbs 90 fluid units and secretes 30 during an hour, its net absorption is 60. A second segment absorbing 120 and secreting 60 has the same net result, with larger opposing flows. A net measurement cannot reveal the size of either component without additional information. This is the same reasoning that distinguished available surface from actual nutrient transfer.
Follow the energy and the evidence
Return to the glucose molecule from the pasta. Its route can now be described without magic: diffusion and mixing bring it near a selective transporter; sodium coupling supports apical entry; a basolateral ATPase helps maintain the driving conditions; an exit pathway permits onward movement into tissue fluid. Supporting blood flow and tissue exchange carry it farther. Each arrow has a different physical or biological explanation.
No single observation proves the whole chain. Transporter expression shows that a protein is present, not necessarily how active it is. A sugar concentration shows an amount per volume, not a flow rate. A labeled signal inside a cell shows entry or retention, not necessarily delivery to blood. Good evidence matches a claim to the compartment and process actually measured.
An experiment that broadly depletes ATP needs particular care. Reduced sugar uptake would be consistent with loss of energetic support, but the intervention could also affect membrane integrity, trafficking and many other cell functions. A stronger mechanistic account checks whether cells remain viable, whether the sodium gradient changed and whether the proposed transport step was measured directly. A selective perturbation and a broad cellular injury are not equivalent tests, even if they produce the same final decrease. Explaining a mechanism requires ruling out relevant alternatives, not merely producing an outcome that agrees with it.
Check your understanding: Why can inhibiting the basolateral sodium–potassium pump reduce apical glucose uptake even though that pump never transports glucose?
Expected answer: The pump helps maintain the sodium electrochemical gradient that drives SGLT1-mediated glucose entry. If the gradient deteriorates, coupled uptake can decline. The energetic support and the nutrient-carrying protein occupy different steps in the mechanism.
Application
Spend 15–20 minutes drawing a cell between lumen and tissue fluid. Add SGLT1, GLUT5, a basolateral glucose exit and the sodium–potassium ATPase. Use separate arrows for sodium, potassium and sugar; mark the ATP-consuming step.
Then use the fictional saturation rule to calculate uptake at concentration 45. Explain why this result does not establish the absorption rate of a real meal.
Model interpretation: Uptake is 90 units per minute: 100 × 45 ÷ 50. The equation describes one invented pathway under fixed assumptions. A meal involves changing concentrations, flow, surface access, several transport routes and downstream removal. The drawing should place the ATPase on the tissue-facing side, not on a microvillus.