The organ and its circulation
A diagram of the urinary system often looks like two beans attached to a bag. It is a useful outline of the plumbing and a poor explanation of the work. Blood does not enter a kidney, turn into urine, and slide down the ureter. Most of what enters through the renal artery leaves through the renal vein. A smaller, changing stream crosses into a separate route, where its composition is extensively altered before it reaches the bladder.
The first task is to make those routes visible. Once you can keep them separate, filtration, water conservation and the kidney's relationship with blood pressure become easier to explain. Without that map, even familiar words such as “filter” encourage the wrong picture.
Place the kidneys behind the abdominal contents
The kidneys normally lie toward the back of the abdomen, on either side of the spine. They are retroperitoneal: behind the lining of the main peritoneal cavity, rather than hanging freely among the intestines. The right kidney usually sits somewhat lower than the left because of the liver. A fibrous capsule covers each kidney; surrounding fat and fascia provide additional support. NCI SEER: kidney location and coverings.
Use the person's right and left when drawing them. A front view reverses their positions on your page. The shared anatomy orientation explains that convention and introduces tissue, circulation and feedback. Here, apply it to a particular organ: place a spine in the middle of a torso outline, then put the kidneys on its two sides, toward the back. Draw the bladder lower down in the pelvis, with a ureter leading from each kidney.
That last distinction prevents a surprisingly durable confusion. A ureter carries urine from a kidney to the bladder. The urethra carries urine from the bladder toward the outside. Two different names identify different stretches of the route. The bladder provides storage; kidney tissue performs the extensive processing that makes the arriving fluid urine. NIDDK: kidneys and urinary outflow.
Location is a relationship, not a point that must be memorized to the millimeter. Human organs vary in size and position. For this course, the important relationships are posterior abdominal location, proximity to major vessels, and a continuous urinary route toward the pelvis. Those relationships explain connections without pretending that every body matches one outline exactly.
A section reveals tissue around a collecting space
A section through a kidney exposes an outer cortex and an inner medulla. The medulla is arranged into pyramids. A pyramid's tip, its papilla, projects toward a small collecting cup called a minor calyx. Smaller cups join larger calyces, which lead into the renal pelvis and then the ureter. Cortical tissue extends between pyramids as renal columns. StatPearls: internal renal anatomy.
The cortex and medulla are working tissue. The pelvis is part of the collecting route. This is more than a vocabulary distinction: a funnel can receive fluid from tissue without performing the microscopic processes that formed that fluid. Coloring the central collecting space differently from the surrounding tissue helps preserve that distinction.
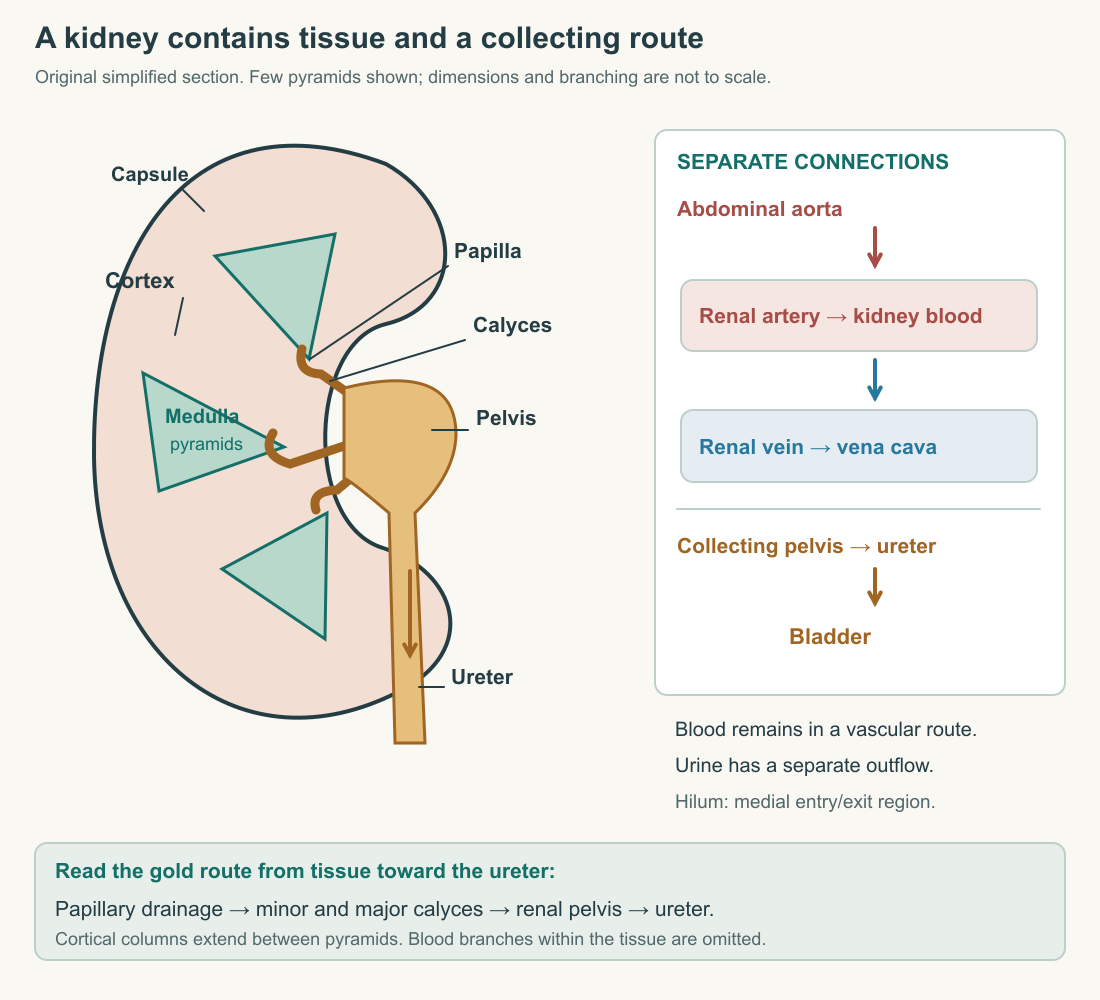
The drawing simplifies shape and shows only a few pyramids. Their number in the picture is a design choice, not a count for every human kidney. Follow one drainage connection from a pyramid tip into a cup and onward. Then follow another. Several local sources join a shared downstream route; there is no requirement that each pyramid have its own ureter.
The hilum is the inward-facing entry and exit region. Blood vessels, nerves, lymphatic vessels and the urinary outflow meet the organ here. The renal artery brings blood from the abdominal aorta, and the renal vein returns blood toward the inferior vena cava. The ureter connects to the collecting pelvis. These adjacent structures carry different contents and have different walls. OpenStax: renal hilum and major connections.
Try covering the labels while leaving the lines visible. You should still be able to distinguish a vessel that enters and branches through tissue from a collecting route that converges and leaves. If the diagram becomes uninterpretable as soon as a label is hidden, examine its connections again. The useful knowledge is a connected map, not a collection of names placed near a bean.
Blood encounters two capillary networks
Inside the kidney, arterial branches lead to afferent arterioles. Each supplies a tuft of capillaries called a glomerulus. Blood then leaves that tuft through an efferent arteriole and enters a second capillary network associated with the tubules. Peritubular capillaries surround tubular regions; the vasa recta include long vessels associated with the medulla. Blood subsequently returns through veins. StatPearls: renal blood flow.
“Afferent” means approaching the glomerulus in this context; “efferent” means leaving it. The efferent arteriole is not the ureter and is not yet the renal vein. Keeping that intermediate vessel in the diagram preserves the two-capillary arrangement.
Draw the blood route as a continuous red line: incoming arteriole, capillary tuft, outgoing arteriole, another capillary region, venous return. Now imagine a red blood cell traveling along it. In the normal route, the cell remains within the vascular system. It does not pass through the tubular lumen on the way to the vein.
This thought experiment is a useful test of any kidney analogy. A household strainer leaves solids behind while liquid runs away. A kidney must maintain a functioning circulation while transferring selected fluid constituents into a different compartment. The strainer image can help introduce separation, but it fails if you imagine blood cells accumulating in the organ while all fluid escapes into the bladder.
The second capillary network also makes a return route physically plausible. Material crossing out of a tubule enters the surrounding tissue fluid and can return to nearby blood. It does not have to travel backward along the tubule to rejoin the circulation. We will examine the transport steps in Chapter 3; for now, make room for that sideways connection on the map.
The nephron starts where two routes approach
A renal corpuscle consists of the glomerular tuft and its surrounding capsule. The capsule encloses a urinary space continuous with the beginning of the tubule. The nephron's tubular sequence includes a proximal tubule, a loop and a distal tubule; connecting segments deliver fluid into the collecting duct system. Different segments have different cellular properties. OpenStax: microscopic kidney organization.
“Lumen” means the interior space of a tube or similar structure. Blood occupies vascular lumens. Tubular fluid occupies a different lumen. Between them lie cells, supporting material and tissue fluid. Two lines touching on a diagram do not mean their contents mix freely.
The capsule's urinary space receives filtrate across the glomerular barrier and directs it toward the proximal tubule. Its outer wall helps enclose that space; it should not be drawn as another filtering sheet that fluid must cross to enter the tubule. StatPearls: Bowman capsule.
Add a gold line beside your blood route. Begin it outside the glomerular capillary lumen, in the capsule's urinary space. Continue through the tubule and collecting system. Place an arrow across the barrier from blood plasma into that gold route. You now have a diagram that can represent filtration without breaking the continuity of blood flow.
Do not draw every nephron as a miniature kidney. A nephron has microscopic segments; it does not contain its own renal pelvis, major artery and ureter. Conversely, a kidney contains many nephrons whose drainage converges. This is a nesting relationship: individual processing routes inside an organ, connected to shared circulation and shared outflow.
Imagine tracing backward from one collecting duct. At a junction, more than one upstream tubular route can contribute fluid. A sample taken after that junction combines their contributions. It cannot, by itself, identify which upstream route supplied a particular molecule. The same reasoning applies at the renal pelvis, where still more drainage has joined. Sampling location therefore matters: a measurement from the final shared outflow describes the combined result, while a claim about one microscopic segment requires evidence that resolves that segment.
Real tissue is less orderly than the teaching map
The Histology Guide's MH 142 specimen is human kidney stained with Azan. Its named Cortex and Medulla views were inspected for this course. In the cortical view, many rounded or oval tubular profiles lie among rounded corpuscular profiles. The medullary view shows conspicuous long, roughly aligned profiles, with blue-stained supporting material between structures. These are observations of the displayed section, not measurements of all kidney tissue. Histology Guide: MH 142 human kidney.
A tube cut across can look like a ring. The same tube cut along its length can look like a channel. An oblique cut can produce an elongated oval. Consequently, apparent shape in a single section depends partly on the cutting plane. A long white profile is not automatically one specific kind of vessel or tubule just because it resembles a familiar drawing.
The slide does not display arrows showing where fluid moved. Those arrows come from anatomical continuity and physiological evidence. Nor does the stain reproduce living tissue colors. Blue is useful here because of how the preparation interacts with the stain, not because the kidney contains blue plumbing.
Compare the two named views by describing arrangement before assigning identities. Are profiles mostly rounded or elongated? Do nearby structures share an orientation? Where is supporting material visible? This order of observation slows down the temptation to identify every pale space from a low-magnification image.
Then return to your schematic. It deliberately straightens or separates structures to make their connections legible. The histological section places them back in dense tissue. Both representations are useful, provided you ask each to answer the right question: the diagram clarifies routes, while the section reveals how crowded and spatially organized those routes actually are.
Three rates that must not be exchanged
Renal blood flow describes blood passing through the organ per unit time. Glomerular filtration rate describes the volume of filtrate formed per unit time. Urine flow describes final urinary volume leaving per unit time. They share the language of volume and time, but the measured streams differ. StatPearls: filtration and renal flow definitions.
Here is an invented accounting example, deliberately expressed in arbitrary units rather than human reference values. During one interval, 100 volume units of blood enter a model organ. Of those, 60 units are plasma and 40 are blood-cell volume. Twelve plasma-volume units cross into a tubular route. Eleven units of water then return from that route to blood, leaving one unit to exit as urine. Ignore other fluid exchanges for this exercise.
The model's incoming blood volume is 100. Its filtrate volume is 12. Its urine volume is one. Calling all three “the amount filtered” erases the very process we are trying to understand. Under the stipulated simplifications, 99 volume units leave on the blood side and one on the urinary side, balancing the 100 that entered.
The example also shows why a small urine stream need not imply a small initial transfer. A large fraction can return. In real kidneys, solutes and water do not all follow one fixed percentage, so the calculation is a map exercise, not a prediction of urine composition.
A concentration adds another question: amount per volume. Suppose the final unit of urine contains four mass units of a particular substance. Its concentration is four mass units per volume unit. If the same four mass units occupy two volume units instead, concentration falls to two while the amount leaving remains four. A change in concentration alone does not establish a change in total excretion.
We will use these distinctions throughout the course. Whenever a statement says “more,” attach a noun and a time interval: more blood volume arriving per minute, more material entering filtrate, more water leaving as urine, or more concentrated urine. The corrected sentence often reveals what additional information an explanation needs.
A map can locate a problem without diagnosing it
Consider three stipulated failures in an otherwise simplified system. In the first, less blood reaches an organ. In the second, the barrier between a capillary and tubular space changes. In the third, the downstream collecting route is obstructed. These events occur at different places on the diagram, even though each could affect urinary function.
The first begins on the supply route; it asks about delivery and pressures. The second begins at an interface; it asks about permeability and what crosses. The third begins downstream; it asks about drainage and the consequences of impaired outflow. No single word such as “blocked” adequately describes all three.
This exercise is deliberately about causal location, not identifying a person's disease from an observation. The map can tell you which measurements would be relevant to a proposed mechanism. It cannot provide measurements that have not been made, determine severity, or exclude simultaneous changes elsewhere.
A more complete explanation also distinguishes immediate and later effects. Stopping a model's outflow changes storage first; what happens upstream depends on whether the system can expand, leak, regulate inflow or transmit pressure backward. A static drawing supplies connections. To predict time-dependent behavior, you must add assumptions about the properties of those connections.
That is the transition into the next chapter. We have located the two routes and their point of transfer. We now need to explain what makes fluid cross the glomerular barrier, what the barrier normally retains, and why entering filtrate is only the beginning of a substance's renal journey.
Application
Draw a kidney section and a separate microscopic route map. On the section, label cortex, medulla, papilla, calyx, pelvis, ureter, artery and vein. On the route map, use one continuous line for blood and another for tubular fluid. Include both capillary networks and one arrow crossing from glomerular blood into the urinary space.
Check your understanding: In the stipulated model, 100 volume units of blood arrive, 12 plasma-volume units enter the tubule and 11 volume units return from the tubule. What leaves by the urinary route, what leaves by the blood route, and why is the efferent arteriole absent from the urinary route?
Expected answer: One volume unit leaves by the urinary route and 99 by the blood route under the stated simplifications. The efferent arteriole carries blood away from glomerular capillaries toward the second capillary network; it does not drain the capsule's urinary space. Filtrate and final urine are different streams because material can cross back after filtration.
Open the linked human slide and compare its named Cortex and Medulla views. Write two observations about visible arrangement and one limit of the image. A defensible account describes round versus elongated profiles and their orientation, while acknowledging that one stained section does not show live fluid direction or identify every profile without further evidence.